
WTI crude oil is testing a major technical barrier after rebounding from a sharp decline. In the supplied five-hour chart snapshot, prices stand near $94.05, just below the 38.2% Fibonacci retracement at $94.66. Although the Moving Average Convergence Divergence (MACD) remains marginally bullish, an elevated Money Flow Index (MFI) and weak Average Directional Index (ADX) raise questions about the rally’s durability. Traders are watching whether buyers can force a sustained breakout or whether resistance will trigger another retreat.
WTI Tests Key Fibonacci Resistance
The WTI crude oil price is approaching $94.66, a retracement level calculated from a preceding price swing. Traders use Fibonacci retracement levels to identify potential areas where a recovery could encounter selling pressure. These levels are reference points, not guaranteed turning points.
The MACD reading of 0.941 remains above its signal line at 0.9289, indicating positive short-term momentum. However, the gap is narrow, so the bullish signal could weaken if prices stall.
The MFI stands at 80.68, above the commonly watched 80 threshold. This suggests buying pressure has become stretched, although overbought readings can persist during strong rallies. The ADX at 14.42 points to a weak trend, making a sustained directional move less certain.
Falling volume as oil approaches resistance adds another reason for caution. Without stronger participation, a move above $94.66 may struggle to hold.
Bearish Risks and Bullish Scenarios
The immediate outlook hinges on the reaction around the $94.66–$95.00 resistance zone. A rejection, particularly alongside a weakening MACD or a bearish candlestick, would support the case for a pullback. The reported lower-high pattern also suggests the broader recovery may remain corrective unless oil breaks through resistance.
Important levels to monitor include:
- Resistance: $94.66, followed by the $95.00 psychological level.
- Near-term support: $92.50–$94.00, a broad consolidation area in the supplied setup.
- Critical support: $91.37, where a breakdown would weaken the bullish case.
- Trend support: The 200-period simple moving average (SMA), whose exact value was not provided in the chart snapshot.
A decisive break above $95.00, supported by rising volume, would improve the bullish outlook. Conversely, a failed breakout could draw prices back toward support. Traders should confirm the move rather than assume that a brief breach signals a new trend.
Oil Price Outlook: Wait for Confirmation
WTI’s technical picture remains mixed: positive MACD momentum conflicts with overbought money flow and limited trend strength. That combination raises the risk of a false breakout or renewed consolidation.
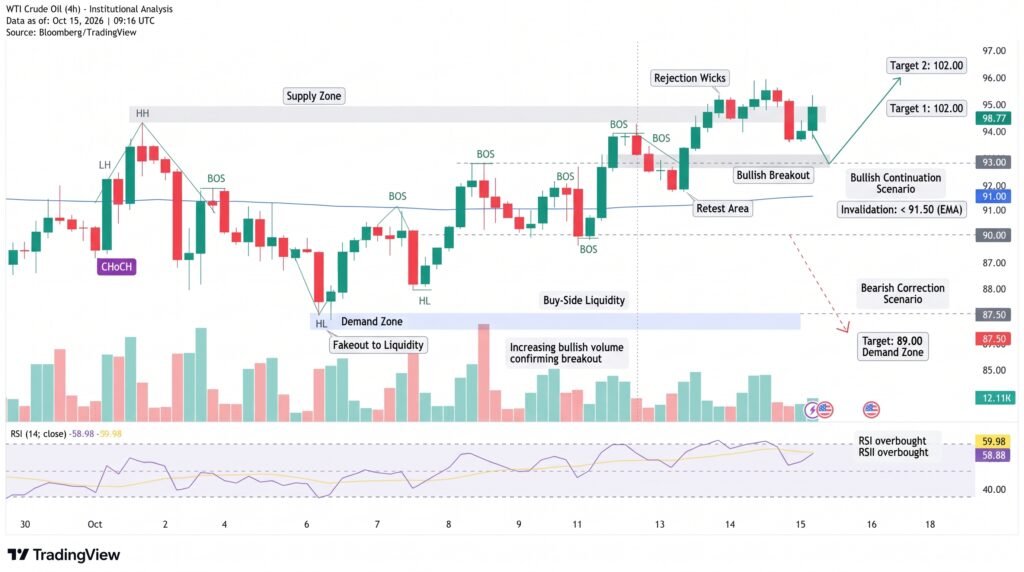
WTI Crude Oil Price Chart – Source: Tradingview
Conclusion:
The $94.66 resistance level is the immediate test for WTI crude oil. A sustained, volume-backed move above $95.00 would strengthen the recovery, while rejection could expose $91.37 support. Traders should define stop-loss levels, account for oil’s volatility and avoid treating any single indicator as a reliable prediction of the next move.
Sources & Methodology
Primary-source standard: Market-moving facts should link to original data releases, regulator notices, company filings or official project announcements whenever available. Secondary reporting is used for additional context, not as a substitute for original evidence.
Page last reviewed: