
The AUD/USD pair traded near 0.6950 on Friday, recovering as lower US Treasury yields weighed on the dollar. However, the Australian dollar faces a difficult outlook after weaker employment data reduced expectations for another Reserve Bank of Australia (RBA) rate increase in November. On the daily chart, a potential head-and-shoulders formation and the pair’s position below its 20-day Exponential Moving Average (EMA) point to continued downside risks. Traders are watching 0.6900 as a key psychological level, with the recent low at 0.6895 offering a more immediate test for sellers.
Australian Jobs Data Weighs on the Aussie
Australia’s September employment report surprised markets with a sharp decline in jobs. According to the Australian Bureau of Statistics, employment fell by 39,300 people, while the seasonally adjusted unemployment rate rose to 4.7%, its highest level in nearly five years. Part-time employment dropped by 73,700, partly offset by an increase of 34,400 full-time positions.
The figures have weakened expectations for another RBA rate hike at its November 2–3 meeting. The central bank raised its cash rate to 4.60% in September as inflation remained elevated, but a cooling labour market complicates the case for further tightening. Inflation data due later in October will help shape policymakers’ next decision.
The Australian dollar has also received some support from softer US Treasury yields. Lower yields can reduce the dollar’s relative return advantage and improve demand for risk-sensitive currencies. The supplied market snapshot showed S&P 500 futures edging higher, suggesting a modest improvement in investor risk appetite.
However, this support may prove temporary if traders continue to scale back expectations for RBA tightening while US yields stabilize.
AUD/USD Technical Analysis: 0.6900 in Focus
The daily chart shows AUD/USD trading around 0.6957, below the 20-day EMA at 0.6995. The Relative Strength Index (RSI) near 41 remains below the neutral 50 threshold, indicating that selling pressure still outweighs bullish momentum.
A potential head-and-shoulders pattern adds to the bearish risk. This chart formation typically signals a possible trend reversal when price breaks below its neckline, although the pattern is not confirmed until that breakdown occurs.
The recent fall below 0.6935, followed by a low near 0.6895, has shifted attention toward the 0.6900 area.
Key levels to monitor include:
- 0.6995: The 20-day EMA and a key recovery hurdle.
- 0.6980: A level that could weaken the immediate bearish bias if reclaimed.
- 0.6935: Former support that has already been breached.
- 0.6900–0.6895: Psychological support and the recent low.
- 0.6865: Potential downside reference at the June low.
What Could Change the AUD/USD Trend?
A sustained break below 0.6895 could strengthen the bearish outlook and expose 0.6865. However, a recovery above 0.6980 would suggest selling pressure is easing and increase the possibility of renewed range trading. A move above 0.6995 would provide a stronger technical signal that buyers are regaining control.
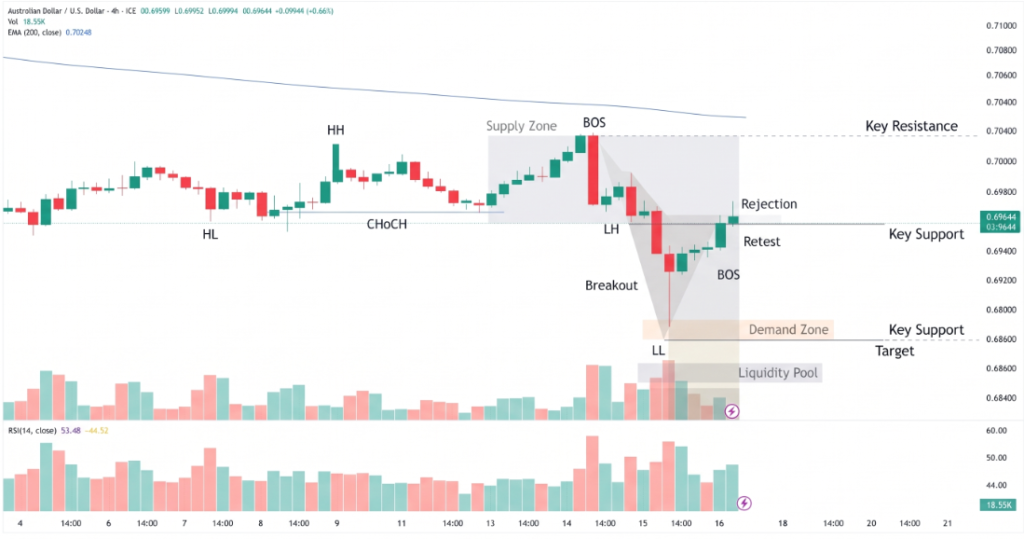
The next move will depend on both price action and changing interest-rate expectations. Traders will also monitor Australian inflation figures and US bond yields for clues about the relative policy outlook.
Conclusion
AUD/USD remains vulnerable as weak Australian employment data reduces expectations for further RBA tightening and technical indicators retain a bearish bias. The 0.6900–0.6895 zone is the immediate downside test, with 0.6865 a potential target if selling accelerates. A recovery above 0.6980 would ease near-term pressure, while a break above the 20-day EMA at 0.6995 would provide stronger evidence of a recovery.
Sources & Methodology
Primary-source standard: Market-moving facts should link to original data releases, regulator notices, company filings or official project announcements whenever available. Secondary reporting is used for additional context, not as a substitute for original evidence.
Page last reviewed: