
Silver traded around $57.37 in the supplied five-hour chart, with a bearish continuation pattern raising the risk of another decline. The metal has retreated sharply from its recent $71.16 high, leaving traders focused on whether support at $55.56 can withstand renewed selling. Although short-term momentum indicators suggest a tentative recovery, silver remains below major technical resistance levels. A confirmed break below support could expose $54.00 and $51.32, while buyers need a sustained move above $58.70–$59.00 to improve the recovery outlook. Recent market coverage also highlights pressure from rising Treasury yields and a firmer US Dollar.
Silver Bear Flag Puts $55.56 Support at Risk
The five-hour chart shows silver consolidating near the lower end of its recent trading range after a steep sell-off. This structure resembles a bear flag, a technical pattern that can develop when prices pause or rebound modestly during a broader decline. The pattern does not guarantee another drop, but a confirmed breakdown would strengthen the bearish case.
The critical level is $55.56. A decisive close below this support could indicate that buyers are no longer absorbing selling pressure effectively. In that scenario, traders may watch $54.00 as the first downside reference, followed by $51.32 if losses accelerate.
The broader technical picture remains weak. Silver trades below the Ichimoku Cloud, its key simple moving averages (SMAs) and the bearish SuperTrend indicator. Together, these signals suggest that sellers retain control of the prevailing trend, even as the market attempts to stabilize.
Silver Forecast: Indicators Show Mixed Signals
Some momentum readings offer limited evidence that selling pressure could be easing. The Moving Average Convergence Divergence (MACD) indicator has produced a tentative bullish crossover, while the Relative Strength Index (RSI) stands at 43.51 after recovering from weaker levels.
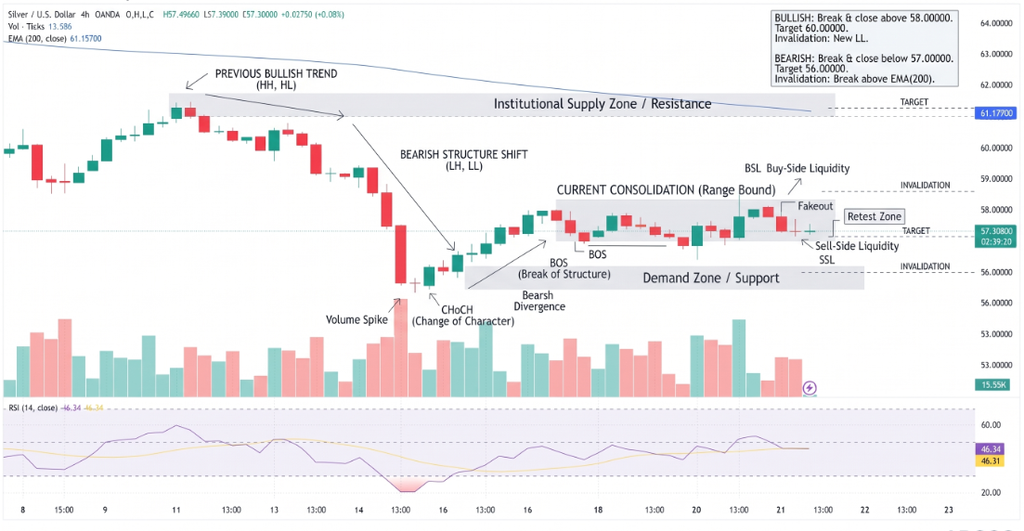
The RSI remains below 50, however, indicating that bearish momentum has not clearly given way to sustained buying pressure. A recent doji candle also points to indecision rather than a confirmed reversal.
Key levels define the next potential move:
- $55.56: Major support; a confirmed break could deepen losses.
- $54.00: First downside target after a breakdown.
- $51.32: Further downside reference if selling intensifies.
- $56.50: Potential near-term area of buying interest.
- $58.70–$59.00: Resistance zone that could limit recovery.
- $58.80: Approximate breakout threshold for a stronger bullish signal.
A move above resistance would challenge the bearish setup, but buyers would need sustained follow-through to establish a more convincing trend change.
Conclusion
Silver remains vulnerable while its price stays below major moving averages and the Ichimoku Cloud. A confirmed break beneath $55.56 would put $54.00 and $51.32 in focus, whereas a sustained recovery above $58.80 would weaken the immediate bearish outlook.
For now, the $56.50–$58.00 area remains prone to volatile price swings and false breakouts. Traders should monitor closing prices, volume and momentum confirmation rather than treating the bear flag as a guaranteed forecast. The technical levels reflect the supplied chart snapshot, not fixed future price targets.
Sources & Methodology
Primary-source standard: Market-moving facts should link to original data releases, regulator notices, company filings or official project announcements whenever available. Secondary reporting is used for additional context, not as a substitute for original evidence.
Page last reviewed: