
EUR/USD trades near 1.1250 as the euro attempts to extend its recovery against the US dollar, but mounting French fiscal concerns and bearish technical signals limit its upside. France’s 10-year government bond yield climbed above 5% on October 21, reaching its highest level since 2002 and raising concerns about the country’s public finances. Meanwhile, investors are assessing the European Central Bank’s (ECB) next policy decision and Federal Reserve guidance. With the currency pair below its 100-day moving average, the recovery remains vulnerable unless buyers reclaim key resistance.
French Debt Concerns Weigh on Euro
Rising French borrowing costs have become a significant obstacle for the single currency. The yield on 10-year French government bonds surpassed 5% as political uncertainty, public spending pressures and difficulties controlling the budget deficit unsettled investors. The spread between French and German government bond yields has also widened, reflecting the additional risk investors associate with French debt.
Higher yields can increase government financing costs and weaken confidence in the euro-area economy. Although a weaker US dollar has provided some support to EUR/USD, concerns specific to France have limited the currency’s ability to capitalize on that move.
The ECB’s deposit facility rate stands at 2.50%, following its September policy adjustment. Markets are assessing whether policymakers will maintain that level at their next meeting or signal further tightening in December. ECB policymaker Fabio Panetta’s scheduled remarks could provide additional clues about inflation and the policy outlook.
Across the Atlantic, Federal Reserve Chair Kevin Warsh has emphasized the importance of incoming economic data rather than committing to a predetermined rate path. The Fed’s October 27–28 meeting and the ECB’s upcoming decision are therefore central to the pair’s near-term direction.
EUR/USD Technical Levels to Watch
The daily chart retains a bearish bias while EUR/USD trades below its 100-day moving average near 1.1455 and the 20-day Bollinger moving average. The Relative Strength Index (RSI) stands near 42, below the neutral 50 threshold, indicating that selling pressure persists despite a modest stabilization.
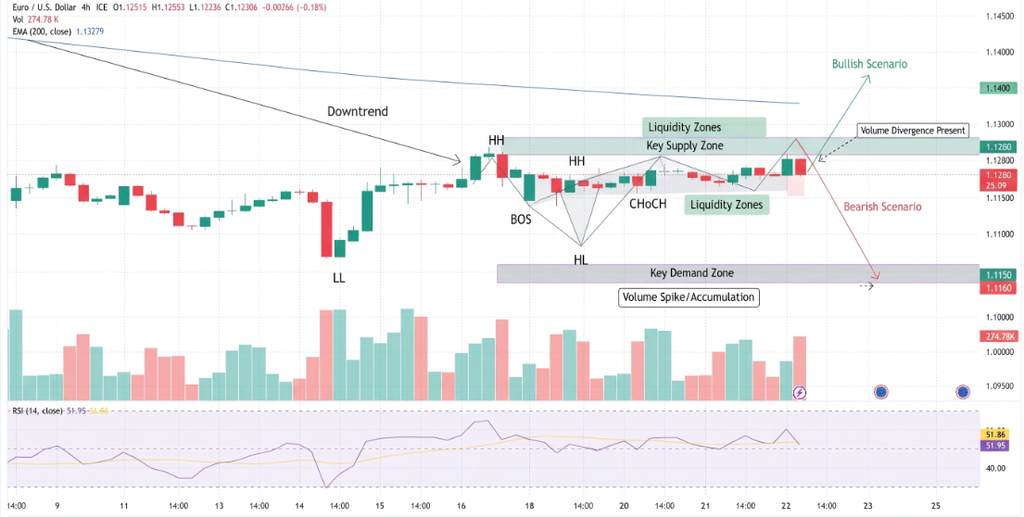
The technical levels to monitor are:
- 1.1276: Initial resistance at the October 6 high.
- 1.1372: Upper Bollinger Band, marking another potential upside barrier.
- 1.1455: 100-day moving average and key level for a broader recovery.
- 1.1185: Initial support at the October 19 low.
- 1.1120: Lower Bollinger Band and subsequent downside reference.
- 1.1000: Major psychological support if selling accelerates.
A break below 1.1185 could expose 1.1120, with the 1.1000 level becoming important if bearish momentum strengthens. Conversely, a sustained move above 1.1276 could open the way toward 1.1372, although the 100-day average remains a more significant obstacle.
Conclusion
EUR/USD remains caught between a softer dollar and mounting concerns about France’s fiscal position. The technical outlook favors sellers while the pair remains below its key moving averages, but central bank decisions and economic data could quickly alter market sentiment. Traders should watch 1.1185 for signs of renewed downside pressure and 1.1276 for an initial recovery signal. A decisive move beyond these levels would help establish the pair’s next direction.
Sources & Methodology
Primary-source standard: Market-moving facts should link to original data releases, regulator notices, company filings or official project announcements whenever available. Secondary reporting is used for additional context, not as a substitute for original evidence.
Page last reviewed: