
Silver prices remain under heavy selling pressure after falling below the $56-per-ounce support level and touching a five-month low. The metal recently traded around $54.06 on the five-hour chart, extending a broader decline as bearish momentum strengthened. Technical indicators point to further downside risk, although deeply oversold conditions could trigger a temporary rebound. Traders are now watching $53.50 for signs of renewed selling, with $52 emerging as the next major downside level if support fails.
Silver Breaks $56 Support
The latest decline confirms a bearish technical structure after silver broke below $56, a level that had provided important support. The move followed a bear flag breakdown, a chart pattern in which a brief consolidation during a downtrend precedes another potential decline.
Silver is trading below its 20-, 50- and 200-period simple moving averages (SMAs), located at $56.75, $58.01 and $62.87, respectively. This alignment indicates that sellers retain control across short-, medium- and longer-term periods. These averages may also act as resistance if prices attempt to recover.
The MACD indicator reinforces the negative outlook. Its reading of -0.94 remains below the signal line at -0.61, indicating that downward momentum continues to dominate.
The Bollinger Bands provide another warning. Silver recently traded beneath the lower band near $54.14, suggesting that prices have extended sharply below their recent average. Such moves can precede short-covering rallies, but they do not independently confirm a trend reversal.
RSI Signals Oversold Conditions
Silver’s 14-period Relative Strength Index stands at 27.26, below the widely watched 30 threshold that indicates oversold conditions. This reading suggests that selling has been unusually intense and that a corrective rebound is possible.
However, oversold does not necessarily mean undervalued. In a strong downtrend, the RSI can remain depressed while prices continue falling. Traders generally look for evidence of stabilisation or bullish divergence before treating an oversold reading as a potential reversal signal.
The next levels to monitor are:
- $53.50: Near-term support where buyers could attempt to stabilise prices.
- $52.00: First major downside target if selling resumes.
- $50.00: Psychological support and a potential test of buyer demand.
- $48.00: A deeper downside scenario if bearish momentum persists.
- $55.50–$56.15: Potential resistance during a recovery.
Silver Price Forecast: Key Scenarios
The immediate outlook remains bearish while silver trades below $56. A decisive break under $53.50 could expose $52, followed by $50 if selling accelerates. A move toward $48 would represent a more extended decline rather than a confirmed outcome.
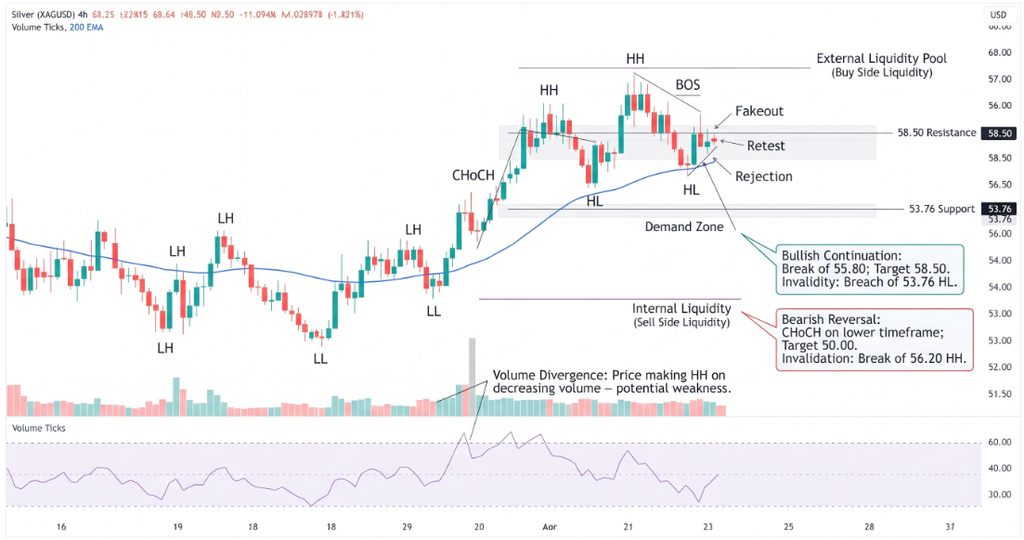
Conversely, a sustained recovery above $56 with stronger trading volume would challenge the breakdown and raise the prospect of a rebound toward $56.75. A move above $58.01 would provide stronger evidence that selling pressure is easing.
Conclusion
Silver faces a difficult technical setup, with bearish momentum and prices below major moving averages favouring sellers. Oversold conditions increase the risk of sharp countertrend rallies, but a durable recovery requires confirmation. Traders should watch $53.50 on the downside and $56 on the upside while accounting for elevated volatility.
Sources & Methodology
Primary-source standard: Market-moving facts should link to original data releases, regulator notices, company filings or official project announcements whenever available. Secondary reporting is used for additional context, not as a substitute for original evidence.
Page last reviewed: