
Quant (QNT) traded around $189 on Monday, extending a roughly 6% rebound from the previous session as buyers attempted to regain control after a sharp pullback. The cryptocurrency had surged about 370% in September, putting its recent recovery in focus. Meanwhile, open interest climbed to nearly $93 million, suggesting that activity in QNT derivatives markets was increasing. The technical picture remains cautiously constructive, with the 50-day exponential moving average near $171 serving as an important support reference. However, a sustained move above $212 is needed to strengthen the bullish case.
QNT Open Interest Signals Market Activity
Data attributed to CoinGlass showed Quant’s open interest rising to $92.98 million from $87.90 million a day earlier. Open interest measures the value of outstanding futures and perpetual contracts that remain open. An increase can indicate that traders are adding positions, but it does not reveal whether those positions are predominantly bullish or bearish.
The figure also remains well below the $192.16 million recorded on October 5, according to the supplied market data. That decline suggests that some leveraged exposure has left the market during QNT’s pullback. The latest increase could indicate renewed participation, although confirmation from price action and funding data would help clarify the direction of trader positioning.
Quant’s broader appeal is linked to its focus on blockchain interoperability through its Overledger technology. The network aims to help applications and organizations connect across different distributed-ledger systems. Interest in this use case can influence sentiment toward QNT, but the token’s short-term price remains sensitive to broader cryptocurrency market conditions and speculative trading.
Quant Price Forecast: Key Levels
QNT is holding above its 50-day exponential moving average near $171, while the 200-day EMA sits much lower, around $109. The separation between these averages suggests that the longer-term trend remains stronger than the recent correction, based on the supplied chart readings.
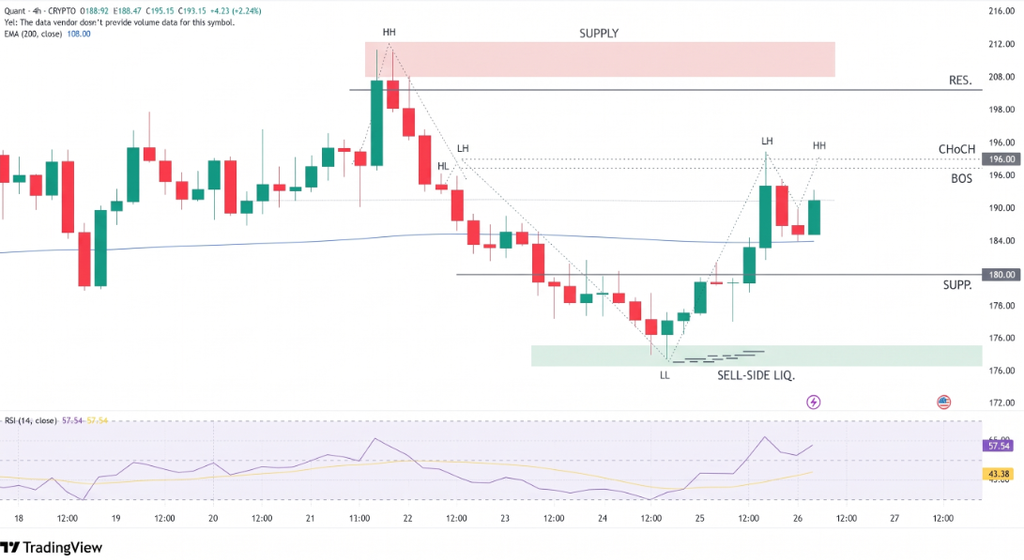
The $150 area provides another support reference. It corresponds to the 50% retracement of the advance from approximately $60 to $373. Fibonacci retracement levels are used by traders to identify possible areas where a pullback could pause; they do not guarantee that support will hold.
Momentum indicators show a more measured picture. The MACD line is slightly below its signal line, while the Relative Strength Index remains just under 50. Together, these readings point to consolidation rather than a confirmed return to strong upward momentum.
Key levels to monitor include:
- $171: Immediate support at the 50-day EMA.
- $150: Secondary support near the 50% retracement.
- $212: Breakout threshold based on last week’s high.
- $373: September rally peak and potential upside reference.
Conclusion
Quant’s rebound has improved the immediate price picture, but buyers still face a significant test near $212. A decisive break above that level could open a path toward higher resistance and bring the September peak back into focus. Conversely, a fall below $171 would weaken the recovery and expose the $150 area. Rising open interest shows renewed derivatives activity, not necessarily stronger buying. Traders should therefore look for a confirmed price breakout and sustained momentum before concluding that QNT’s next major advance has begun.
Sources & Methodology
Primary-source standard: Market-moving facts should link to original data releases, regulator notices, company filings or official project announcements whenever available. Secondary reporting is used for additional context, not as a substitute for original evidence.
Page last reviewed: