
Brent crude oil faces a technical correction after climbing to $117.45 on October 23, its highest level since April, before retreating as traders reassessed supply risks and developments in the Middle East. In the supplied five-hour chart, the price reference of $109.90 sits near the lower boundary of the Ichimoku cloud, placing a key support area under pressure. A bearish MACD crossover, a Relative Strength Index below 50 and heavier selling on recent candles suggest momentum has weakened, although the broader trend may not yet be broken.
Brent Oil Reverses From $117.45 Peak
The latest pullback follows a sharp rally driven by concerns that escalating regional conflict could disrupt crude shipments and tighten global supply. Brent crude prices rose toward $117.45 on October 23 before easing. On October 26, oil prices remained volatile as traders weighed geopolitical risks against diplomatic efforts to reduce tensions.
The supplied chart identifies a bearish engulfing candle near the recent peak. This pattern occurs when a larger bearish candle covers the body of the preceding bullish candle, potentially signalling a change in short-term momentum. The pattern alone, however, does not establish that a longer-term downtrend has begun.
The Ichimoku cloud, which combines several trend and momentum measures, places the relevant cloud zone around $109.89–$112.53. Holding above the lower boundary could help stabilize prices, while a decisive break beneath it would increase the risk of a deeper correction.
Key Technical Levels and Signals
The chart’s momentum indicators currently lean bearish. The MACD line is at 1.08, below its signal line at 1.57, indicating weakening upward momentum. Meanwhile, the RSI has slipped to 46.22, below the neutral 50 threshold. Recent selling candles also show elevated volume, according to the supplied analysis.
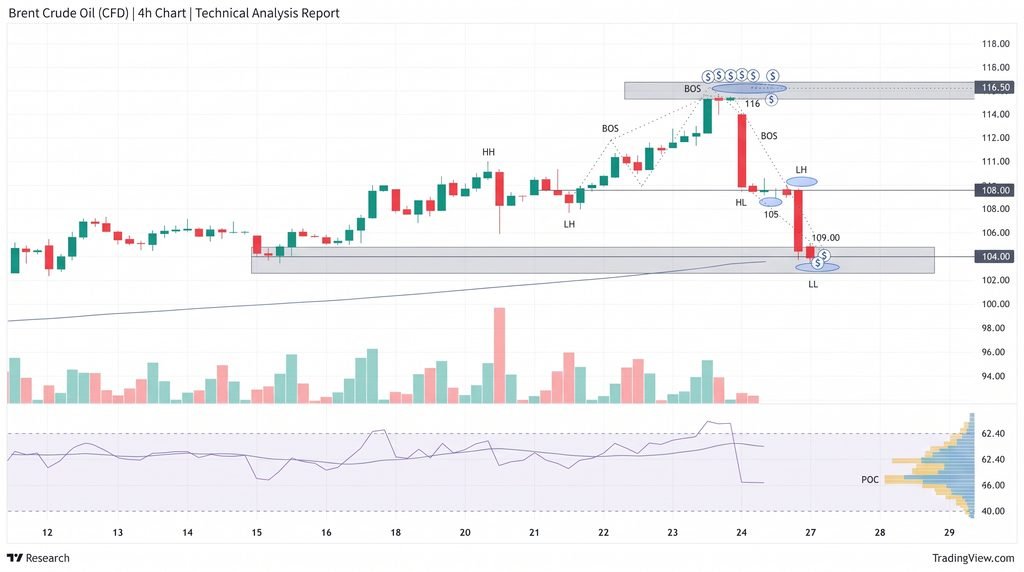
The 200-period simple moving average stands near $102.83, providing a deeper reference for the broader trend. The chart also identifies Fibonacci retracement levels based on the move from $95.13 to $117.45.
Important levels to monitor are:
- $113.35: Bullish invalidation level in the supplied setup.
- $111.70–$113.35: Resistance zone where rallies may encounter selling.
- $108.93: 38.2% Fibonacci retracement and nearby structural support.
- $106.29: 50% retracement and a deeper correction target.
- $102.83: 200-period SMA reference.
The average true range (ATR) is 1.91, or about 1.74% of the chart’s reference price, indicating meaningful short-term price fluctuations.
Conclusion
Brent’s immediate outlook remains vulnerable while momentum indicators point lower and prices struggle to hold cloud support. A sustained break below $108.93 would strengthen the case for a move toward $106.29. Conversely, a recovery above $111.70–$113.35 would weaken the bearish setup. Traders should wait for price confirmation rather than assume the parabolic rally has fully reversed.
Sources & Methodology
Primary-source standard: Market-moving facts should link to original data releases, regulator notices, company filings or official project announcements whenever available. Secondary reporting is used for additional context, not as a substitute for original evidence.
Page last reviewed: