
Brent crude is consolidating after retreating from a recent peak of $117.45, with weakening momentum raising the risk of a deeper correction. The supplied technical chart places Brent near $111.39, below its 20-period moving average but above its 50-period and 200-period averages. This leaves the market caught between short-term selling pressure and a longer-term uptrend. Traders are watching $109 support and $113.50 resistance for confirmation of the next move, while geopolitical supply risks continue to influence the broader oil market.
Brent Oil Faces Resistance After Reversal
The chart identifies an Evening Star candlestick pattern near $117.45 on October 25. This three-candle formation can signal a bearish reversal after an advance, particularly when subsequent price action confirms the shift. A bearish divergence in the Relative Strength Index (RSI) also suggests that buying momentum weakened as prices approached the recent high.
The MACD indicator has turned lower, with its reading at 0.07 below the signal-line value of 0.39. Brent is also trading below its 20-period simple moving average at $111.99. These signals point to near-term pressure, although the price remains above the 50-period average at $109.64 and the 200-period average at $103.70.
The Ichimoku Cloud, between $110.41 and $111.59 on the supplied chart, represents another area traders are monitoring for support. Declining volume during consolidation, however, means the next directional move still needs confirmation.
Key Brent Oil Levels to Watch
The immediate trading range is defined by support around $109 and resistance near $113.50. A sustained break below $109 could expose the $108.17 Fibonacci retracement area, followed by the $103.70 long-term moving average. A deeper correction could bring $102.42 into view.
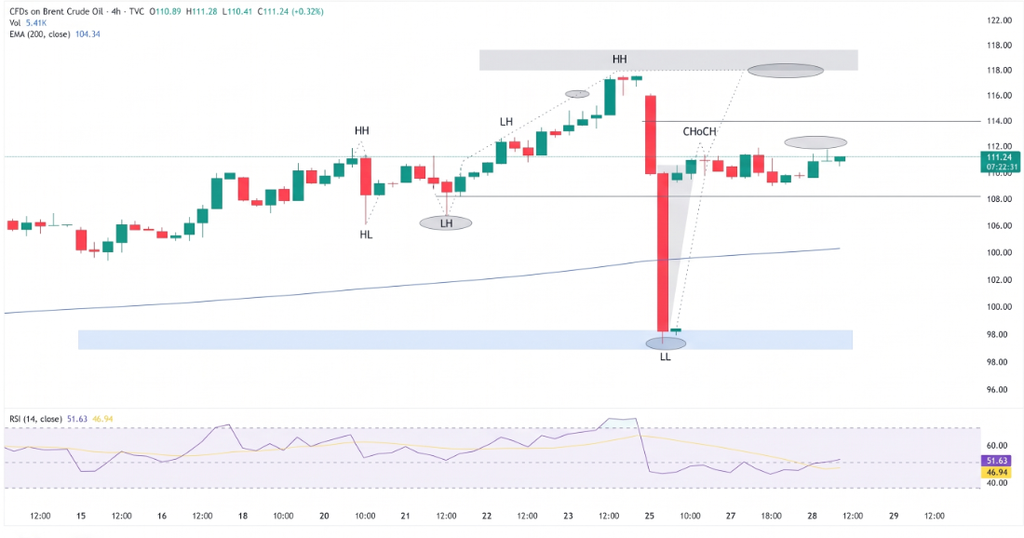
The principal chart levels are:
- Support: $109.00, $108.17, $103.70 and $102.42.
- Resistance: $112.50–$113.50, followed by $117.45.
- Bullish signal: A sustained break above $113.50 would improve the recovery outlook.
- Bearish signal: A confirmed move below $109 would strengthen the downside case.
Brent’s Average True Range (ATR) stands at 1.79, or roughly 1.6% of the quoted price, indicating substantial short-term movement. The chart therefore favors caution within the $109.64–$112.50 range, where conflicting signals could produce choppy trading.
Conclusion: $109 Support Defines the Risk
Brent’s short-term outlook remains uncertain, with bearish momentum indicators contrasting with support from the 50-period and 200-period moving averages. A break below $109 could deepen the correction toward $103.70, while a recovery above $113.50 would weaken the immediate bearish case and reopen the path toward $117.45.
Fundamentals remain important. Reuters reported on October 28 that Brent futures rose to around $115.47 after renewed concerns about Middle East supply disruptions following reports of an attack on a major Saudi refinery. The move followed Tuesday’s settlement at $113.88, illustrating how quickly geopolitical developments can shift oil prices.
Traders should distinguish the supplied chart levels from newer market quotes and watch both price confirmation and developments affecting global crude supply before judging whether the pullback will extend.
Sources & Methodology
Primary-source standard: Market-moving facts should link to original data releases, regulator notices, company filings or official project announcements whenever available. Secondary reporting is used for additional context, not as a substitute for original evidence.
Page last reviewed: