
Pi Network traded higher on Monday, approaching a long-term descending resistance trendline near $0.0788 as signs of improving momentum emerged. The move comes despite weak sentiment across the broader cryptocurrency market, where the Crypto Fear and Greed Index has fallen to 36, indicating fear among investors. Meanwhile, PI futures activity has increased, suggesting renewed trader participation. The token now faces an important technical test: a sustained move above $0.0788 could strengthen the recovery, while rejection at resistance may send prices back toward nearby support.
PI futures activity rises despite market fear
Pi Network’s derivatives market is showing signs of increased participation. According to the figures supplied from Blockworks, PI futures Open Interest (OI) has climbed to $8.55 million from $7.91 million a week earlier.
Open Interest measures the total value of outstanding futures contracts that remain unsettled. An increase generally indicates that traders are opening or maintaining more positions. However, it does not reveal whether those positions are predominantly bullish or bearish. The direction of price movement and funding-rate data are also important when assessing market positioning.
The increase in OI suggests that traders are paying closer attention to PI as it approaches a key resistance area. If buying activity strengthens alongside rising prices, the additional participation could support a breakout attempt. Conversely, a rise in leveraged positioning can increase volatility if the market moves against crowded trades.
Broader sentiment remains a challenge. The Fear and Greed Index stands at 36, down from 43 the previous week. The reading places the market in the fear category, reflecting caution among cryptocurrency investors.
Pi Network tests $0.0788 resistance
PI trades near $0.0784, just below a descending trendline around $0.0788 connecting the June 20 and September 30 highs. This resistance has limited previous recovery attempts and represents the immediate barrier bulls need to overcome.
The token remains below its 50-day and 200-day exponential moving averages (EMAs), positioned at $0.0828 and $0.1114, respectively. That alignment indicates the broader technical structure remains under pressure.
Momentum indicators, however, are improving. The Moving Average Convergence Divergence (MACD) has crossed above its signal line while remaining below zero. Meanwhile, the Relative Strength Index (RSI) has risen to 45, moving away from oversold territory toward its neutral midpoint.
PI price forecast: Levels to monitor
A confirmed break above $0.0788 could open the way toward the following resistance levels:
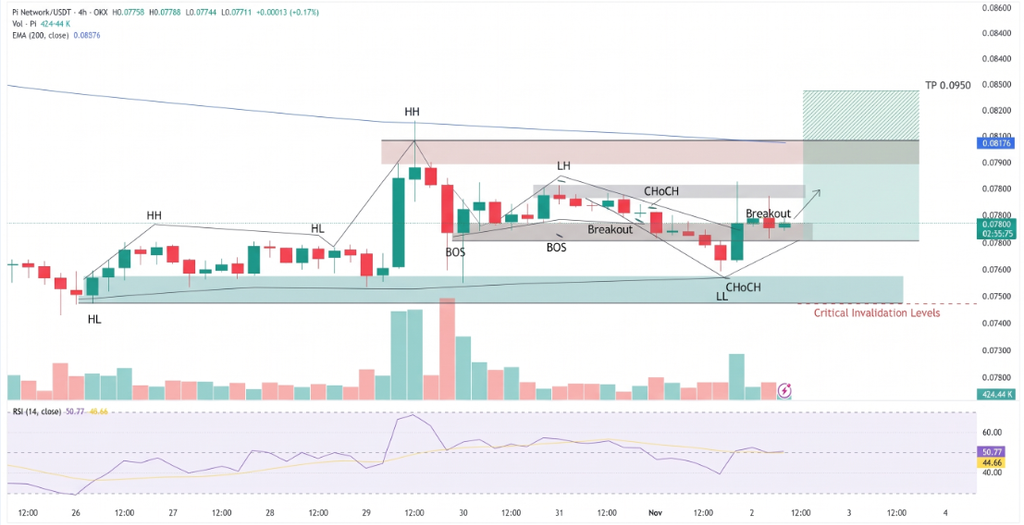
- First target: 50-day EMA at $0.0828.
- Higher target: $0.1049, the 50% Fibonacci retracement of the decline from $0.1394 to $0.0704.
- Longer-term resistance: 200-day EMA at $0.1114.
On the downside, initial support stands near the October 15 low at $0.0740. A break below that level could expose the $0.0704 swing low, which marks an important support reference.
Conclusion:
Pi Network is showing early signs of recovery as futures Open Interest increases and momentum indicators improve. However, the $0.0788 trendline remains the decisive near-term barrier. A sustained breakout could strengthen the bullish case toward $0.0828 and $0.1049. Failure to clear resistance, followed by a break below $0.0740, would weaken the recovery and put $0.0704 back in focus.
Sources & Methodology
Primary-source standard: Market-moving facts should link to original data releases, regulator notices, company filings or official project announcements whenever available. Secondary reporting is used for additional context, not as a substitute for original evidence.
Page last reviewed: