
West Texas Intermediate (WTI) crude oil is caught between long-term support and a cluster of short-term resistance levels, leaving its next move dependent on whether buyers can defend the $96 area. The supplied five-hour technical snapshot places WTI at $98.04, above its 200-period Simple Moving Average (SMA) at $96.09 but below the Ichimoku cloud and shorter-term moving averages. Bearish momentum is building, although a hammer candle near $96.84 offers a possible early signal of buying interest.
WTI faces pressure below key resistance
The broader technical picture is mixed. WTI remains above its 200-period SMA, suggesting that the longer-term upward structure has not yet been invalidated. The price also trades above the Volume Weighted Average Price (VWAP) at $97.22, indicating some underlying support from volume-weighted trading activity.
However, the shorter-term indicators are less encouraging. WTI remains below its 20-period SMA at $100.87 and 50-period SMA at $100.48. The Ichimoku cloud, positioned around $100.06–$100.07, creates another resistance barrier. The Ichimoku indicator helps traders assess trend direction, momentum and potential support or resistance.
Momentum readings also favor caution. The Moving Average Convergence Divergence (MACD) line stands at -0.89, below its signal line at -0.21, indicating negative momentum. The Relative Strength Index (RSI) is 41.80, below the neutral 50 threshold but not yet in conventional oversold territory.
A double-top formation near $106.75 is approximately 70% complete in the supplied analysis. Its confirmation would require a decisive break of the relevant neckline; the pattern remains a developing possibility, not an established reversal.
$96 support defines the trading range
The $96.00 trendline has attracted three support tests, while resistance around $101.00 has been tested four times. This leaves WTI in a consolidation range where neither side has established control.
A hammer candle near $96.84 on November 3 signals that buyers attempted to defend lower prices. However, declining volume near support weakens the conviction behind that signal.
The key technical levels are:
- Support: $96.00–$96.09, including the 200-period SMA
- Lower support: $95.50, followed by $94.41
- Resistance: $100.00–$101.00
- Higher resistance: $105.80 and $106.75
- Fibonacci support: $90.60 and $86.79
The Fibonacci retracement levels are calculated from the $74.45–$106.75 price range. The 38.2% retracement lies at $94.41, while the 50% and 61.8% levels stand at $90.60 and $86.79.
WTI scenarios: Breakout or breakdown?
The bearish scenario gains strength if WTI closes below its 200-period SMA at $96.09 on the five-hour chart. A more conservative bearish entry in the supplied plan is $95.80 after that confirmation. The projected downside objectives are $90.60, $86.79 and $80.00, with a proposed stop at $98.45.
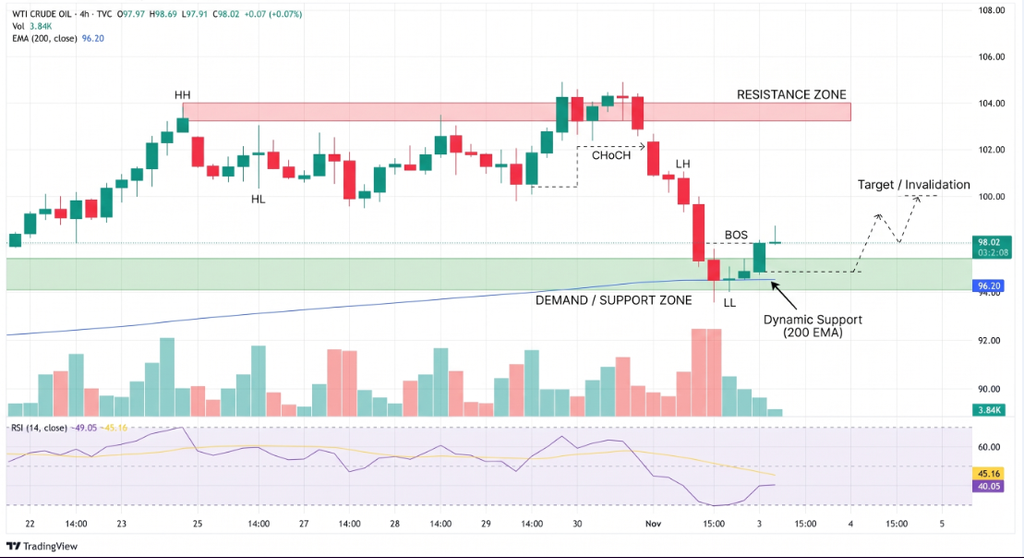
The bullish alternative requires stronger evidence. An initial recovery from the hammer formation could support a move toward $100, but a five-hour close above $101.20 would provide more meaningful confirmation. The upside targets are $105.80, $106.75 and $110.00, with a proposed stop at $98.55 for that conservative entry.
Average True Range (ATR) stands at $1.77, or approximately 1.8%, highlighting the potential for sizeable price swings.
Conclusion
WTI remains neutral within the $96.50–$100.00 no-trade zone identified by the supplied analysis. A confirmed break below $96.09 would expose deeper Fibonacci support, while a sustained move above $101 could shift momentum toward buyers. Until either boundary gives way, the market remains vulnerable to choppy trading and false breakouts.
Sources & Methodology
Primary-source standard: Market-moving facts should link to original data releases, regulator notices, company filings or official project announcements whenever available. Secondary reporting is used for additional context, not as a substitute for original evidence.
Page last reviewed: