
Silver has recovered to around $51.76 after finding support near $48.62, but the rebound is unfolding within a broader bearish structure. Improving momentum indicators and stronger buying volume suggest sellers have lost some short-term control. However, the metal remains below its 50-day and 200-day moving averages, while the SuperTrend indicator continues to signal downward pressure. The next test is concentrated between $53.09 and $53.94, where several technical resistance levels converge. Until silver clears that zone, the recovery remains vulnerable to another decline.
Silver rebound challenges bearish structure
Silver’s latest advance has improved its short-term technical profile. The price has moved above the 20-day simple moving average (SMA) at $50.65, while the Relative Strength Index (RSI) has climbed to 52.41. An RSI reading above 50 generally indicates that buying momentum is gaining strength, although it does not independently confirm a sustained trend reversal.
The Moving Average Convergence Divergence (MACD) also supports the recovery. Its reading of -0.7855 is above the signal line at -1.0574, indicating improving momentum despite both values remaining below zero.
The rebound has also been accompanied by increasing volume and a reported bullish divergence in MACD and RSI around the $48.62 low. A bullish divergence occurs when price makes a lower low while an indicator forms a higher low, potentially signaling weakening selling pressure.
However, the broader trend remains negative. Silver is trading below its 50-day SMA at $53.09 and 200-day SMA at $60.02. The price also remains beneath the Ichimoku cloud, which spans approximately $50.94 to $53.51. The downward SuperTrend reading adds another obstacle to the recovery.
$53.94 resistance defines the next move
The immediate challenge for buyers is the resistance cluster between $53.09 and $53.94. The 50-day SMA sits at $53.09, while the upper boundary of the Ichimoku cloud and the 23.6% Fibonacci retracement reinforce resistance around $53.50–$53.94.
The Fibonacci levels are measured from the $71.16 high to the $48.62 low. A sustained move above $53.94 would strengthen the recovery and expose the next retracement level near $57.23. Even then, silver would need to overcome further resistance before challenging its 200-day average.
On the downside, $50.65 is the first important support, followed by the broader $49.50–$50.65 demand zone. A renewed decline below $48.62 would invalidate the immediate bullish recovery setup.
Silver outlook: Key levels to monitor
The current setup favors caution while price trades around $51.00–$52.50, where the market is testing resistance without confirming a breakout.
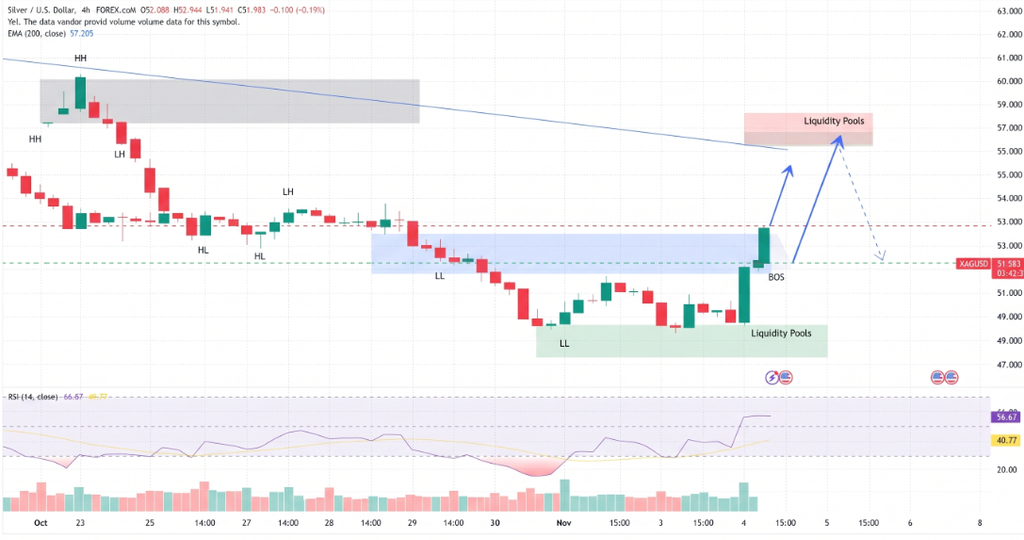
Important technical levels include:
- Resistance: $53.09, $53.50–$53.94 and $57.23.
- Support: $50.65, $49.50 and $48.62.
- Long zone: $49.50–$50.65, if support holds.
- Short zone: $53.09–$53.94, if resistance rejects price.
The average true range (ATR) stands at 0.99, or roughly 1.9% of the quoted price, indicating that daily price swings remain meaningful.
Conclusion
Silver’s rebound has improved momentum, but it has not overturned the broader downtrend. A sustained break above $53.94 would provide stronger evidence of recovery, while rejection near $53.09 could expose support around $50.65 and $48.62. Until resistance gives way, the move remains a counter-trend bounce rather than a confirmed bullish reversal.
Sources & Methodology
Primary-source standard: Market-moving facts should link to original data releases, regulator notices, company filings or official project announcements whenever available. Secondary reporting is used for additional context, not as a substitute for original evidence.
Page last reviewed: