
The USD/JPY pair traded lower on Thursday but recovered part of its earlier losses as investors assessed the implications of the U.S. midterm election results for the dollar. The exchange rate hovered around 158.41, down approximately 0.20%, while its daily chart showed a potential bullish pin-bar formation. However, the recovery faces a significant technical barrier at the 200-day Simple Moving Average (SMA), near 158.62. With the pair trapped between its 50-day and 200-day moving averages, traders are watching whether buyers can establish enough momentum to challenge the 159.00 level.
USD/JPY consolidates below 158.62
The USD/JPY exchange rate remained under pressure following the latest U.S. political developments, although its recovery from session lows suggested that buyers were still defending lower price levels.
The pair’s position between the 50-day SMA at 157.39 and the 200-day SMA at 158.62 highlights the ongoing struggle between bullish and bearish traders. The 50-day average represents the medium-term trend, while the 200-day average is commonly used to assess the broader market direction.
A bullish pin bar is also developing on the daily chart. This candlestick pattern typically features a long lower shadow, indicating that sellers pushed prices down before buyers regained control. However, the formation requires confirmation from subsequent price action before it can establish a reliable bullish signal.
The broader technical structure remains cautious. USD/JPY continues to record lower highs and lower lows, suggesting that sellers retain an advantage despite the latest recovery.
159.00 breakout could target 160.39
For buyers, the immediate challenge is to reclaim the psychological 159.00 threshold and establish a sustained move above the 200-day SMA at 158.62.
A successful breakout could bring the 100-day SMA at 159.16 into focus. Further buying pressure may then open the way toward the psychological 160.00 level.
The Relative Strength Index (RSI), a momentum indicator that measures the speed and strength of price movements, remains in bullish territory but is turning lower. This suggests that upward momentum may be losing strength.
A decisive move above 160.00 would improve the technical outlook considerably. It could also expose the September 2 high at 160.39, a level that would challenge the existing sequence of lower highs.
Important bullish levels include:
- 158.62: 200-day SMA resistance.
- 159.00: Immediate psychological resistance.
- 159.16: 100-day SMA.
- 160.00–160.39: Psychological resistance and September 2 high.
157.39 support holds bearish outlook
The downside scenario becomes more compelling if sellers push USD/JPY below 158.00 and subsequently break the 50-day SMA at 157.39.
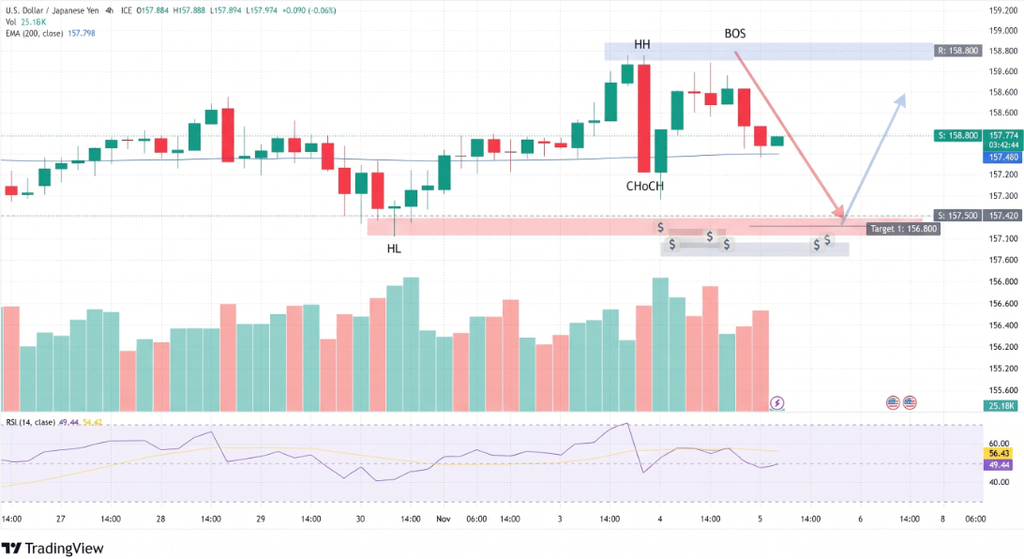
A confirmed move beneath this moving average would weaken the recovery and expose the psychological 157.00 support level. Additional selling could then direct attention toward the October 23 daily low at 156.08.
The RSI’s downward direction reinforces the possibility of renewed selling pressure, although confirmation from price action remains essential.
Conclusion
USD/JPY remains caught between important moving averages, with 158.62 acting as the immediate upside barrier and 157.39 providing medium-term support. A breakout above 159.00 could strengthen buying interest toward 160.00 and 160.39. Conversely, a sustained break below 157.39 would reinforce the bearish structure and expose 156.08. Until either boundary gives way, the pair’s near-term outlook remains uncertain.
Sources & Methodology
Primary-source standard: Market-moving facts should link to original data releases, regulator notices, company filings or official project announcements whenever available. Secondary reporting is used for additional context, not as a substitute for original evidence.
Page last reviewed: