Natural gas prices are consolidating near $2.950, caught between support from short-term moving averages and resistance at the 200-day moving average near $2.996. A Doji candlestick has emerged at the current price, signaling indecision as trading volume declines and momentum weakens. Although the MACD remains marginally bullish, an extremely low ADX reading points to a market lacking a clear trend. Traders are watching for a decisive move above resistance or below support to determine the next direction.
Natural Gas Faces $2.996 Resistance
Natural gas is trading above its 20-day and 50-day simple moving averages, suggesting that its short-term recovery remains intact. The MACD indicator also retains a positive configuration, with its reading at 0.0073 compared with a signal line of -0.0005.
The SuperTrend indicator places trend support at $2.801, while the Ichimoku cloud’s upper boundary near $2.935 provides another reference level. However, the 200-day moving average at $2.996 remains a significant barrier to further gains.
The Average Directional Index (ADX) stands at just 8.67, indicating exceptionally weak trend strength. This increases the possibility of choppy trading and false breakouts. Declining volume reinforces the lack of conviction behind the current consolidation.
A Doji candle formed near $2.950 on November 5, reflecting a balance between buying and selling pressure rather than a clear directional signal.
Key Natural Gas Support and Resistance
The immediate trading range is defined by support near $2.895 and resistance around $2.996. A Fibonacci retracement analysis of the $2.620-$3.334 range places the 50% level at $2.977 and the 61.8% level at $3.061.
These levels create an important resistance cluster between $2.977 and $2.996. A sustained move above this area could improve the technical outlook, while failure to break through may encourage sellers.
Key levels to monitor include:
- Immediate support: $2.895
- Major resistance: $2.996
- Bullish invalidation: $3.000
- Bearish invalidation: $2.800
- Average True Range: $0.0552, or approximately 1.87%
The preferred long-entry zone is $2.850-$2.895, while the $2.980-$3.020 area represents a potential short-entry zone. The $2.900-$2.970 range remains less attractive because of overlapping technical signals.
Natural Gas Forecast: Breakout or Breakdown?
A bullish scenario requires natural gas to reclaim resistance and confirm the move with stronger trading volume. An aggressive entry is identified near $2.980 following a five-hour close above VWAP and the cloud. A more conservative confirmation would come above $3.020, after a five-hour close beyond the 200-day moving average.
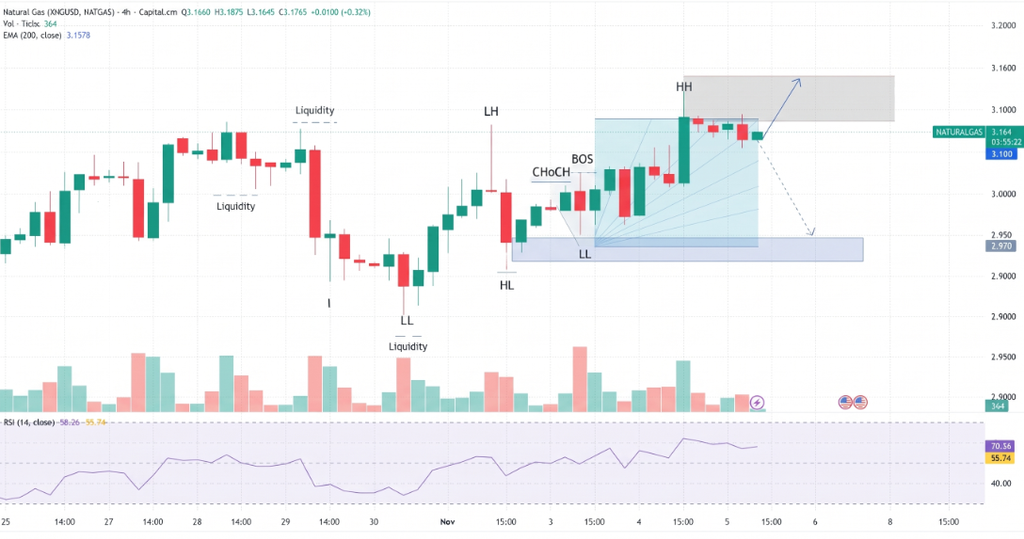
Upside objectives stand at $3.110, $3.220 and $3.330, with a protective stop near $2.897 under the supplied trading plan.
The bearish alternative would gain traction if prices break below VWAP near $2.930. A more conservative short signal requires a five-hour close below the 50-day moving average, with $2.880 identified as an entry level. Downside targets are $2.800, $2.720 and $2.620, while the proposed stop is $3.013.
Conclusion
Natural gas remains directionless near $2.950, with weak trend strength and declining volume limiting confidence in either side. The $2.977-$2.996 resistance cluster is the immediate test for buyers. Until prices break above $3.020 or lose key support, preserving capital and avoiding trades inside the $2.900-$2.970 consolidation zone may offer a more disciplined approach.
Sources & Methodology
Primary-source standard: Market-moving facts should link to original data releases, regulator notices, company filings or official project announcements whenever available. Secondary reporting is used for additional context, not as a substitute for original evidence.
Page last reviewed: