Silver is testing a major resistance zone near $53.40, where several technical indicators converge against a broader bearish trend. Although the metal has recovered from its recent low of $48.62, improving short-term momentum has yet to reverse the longer-term decline. The latest readings show silver trading near $52.75, with a bearish Ichimoku cloud, declining volume and a doji candle highlighting uncertainty. A sustained break above $53.40 could strengthen the recovery, but rejection at this level would increase the risk of another move lower.
Silver Faces Strong $53.40 Resistance
Silver’s immediate challenge is the resistance band between $52.80 and $53.40. Several indicators reinforce this area, making it an important test for buyers.
The metal is trading near its volume-weighted average price (VWAP) of $52.83 and remains inside the Ichimoku cloud, which stretches from $51.38 to $53.39. The cloud’s upper boundary represents a key obstacle for the recovery. The 50% Fibonacci retracement, calculated from the recent $48.62-$58.17 range, also stands at $53.39.
Meanwhile, the 200-day simple moving average is near $59.66, indicating that silver’s broader trend remains under pressure. A short-term improvement does not yet establish a long-term bullish reversal.
The November 5 doji candle near $52.75 adds to the uncertainty. This formation occurs when opening and closing prices are close together, often reflecting indecision between buyers and sellers. Falling volume also suggests that the recovery has not attracted strong conviction.
Bullish Momentum Meets Bearish Structure
Some indicators show that buyers have regained short-term control. The MACD reading has improved, with its line at -0.0012 above the signal line at -0.4804. The SuperTrend indicator has also turned positive near $50.01, while silver trades above its 20-day simple moving average at $50.79.
A bullish RSI divergence near the recent $48.62 low suggests that downward momentum weakened as prices tested support. However, this signal alone does not confirm a trend reversal.
The chart also shows a potential bear flag, with the pattern estimated to be around 70% complete. If resistance holds, the formation could precede another decline. Its downside Fibonacci extension points toward $47.30.
Important levels to monitor include:
- Resistance: $52.80-$53.40.
- Bullish invalidation: A sustained move above $53.40.
- Support: $50.01, followed by the $49.50-$50.50 zone.
- Downside target: $47.30 if selling pressure resumes.
Silver Price Outlook: Breakout or Rejection?
The immediate outlook favors caution while silver remains below $53.40. A rejection from the resistance band could send prices toward $50.50, with the SuperTrend level around $50.01 providing another potential support test.
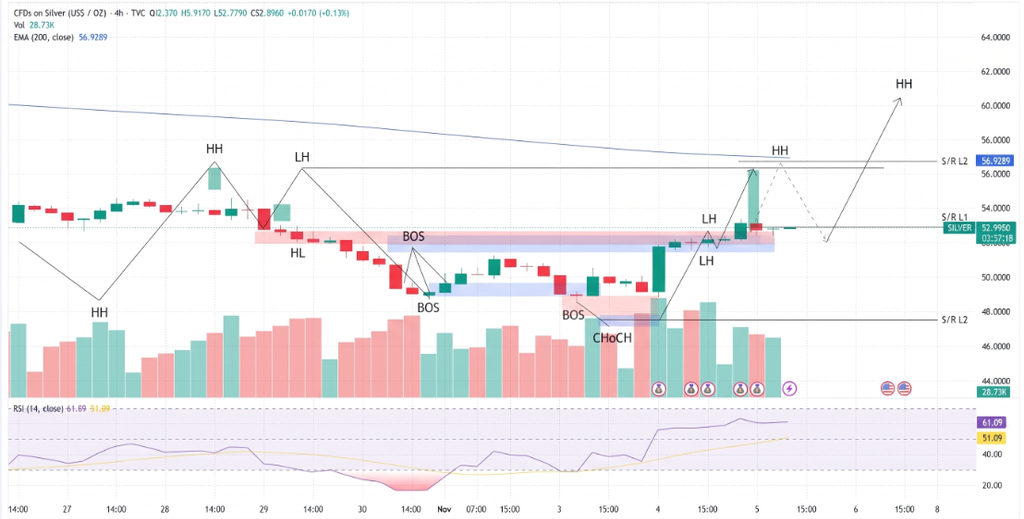
A decisive break above $53.40 would weaken the bearish setup and suggest that buyers are gaining control. However, confirmation would require stronger trading volume and sustained price action above the resistance zone.
The $50.50-$52.80 area remains a less attractive zone for directional positions because mixed signals could produce volatile, sideways trading.
Conclusion
Silver’s recovery has improved short-term momentum, but the broader technical structure remains bearish. The $53.39-$53.40 resistance confluence is the decisive area to watch. Failure to break above it could reinforce the bear-flag pattern and expose the metal to renewed losses toward $50 and potentially $47.30. A sustained breakout, supported by stronger volume, would challenge the bearish outlook. Until that happens, the rally remains vulnerable to rejection rather than a confirmed trend reversal.
Sources & Methodology
Primary-source standard: Market-moving facts should link to original data releases, regulator notices, company filings or official project announcements whenever available. Secondary reporting is used for additional context, not as a substitute for original evidence.
Page last reviewed: