
Solana extended its decline on Friday, falling around 4% and trading below $80 as a broader cryptocurrency sell-off intensified. SOL had lost nearly 10% for the week, while Bitcoin dropped beneath $70,000 and triggered substantial liquidations across derivatives markets. Weak futures positioning, continued selling pressure and deteriorating technical indicators have left Solana vulnerable to further losses. Although the token is deeply oversold, that condition alone may not be enough to trigger a sustained recovery.
Crypto liquidations deepen market pressure
The broader digital-asset market faced heavy selling as Bitcoin’s decline below $70,000 accelerated forced closures of leveraged positions. According to the supplied CoinGlass data, approximately $1.41 billion in cryptocurrency positions were liquidated over 24 hours, including $1.26 billion in long positions.
Long liquidations occur when traders who borrowed or used leverage to bet on rising prices are forced to close their positions after the market moves against them. The scale of these liquidations highlights how vulnerable leveraged traders have become during the latest downturn.
Solana’s derivatives market has also shown signs of weakening demand. The supplied figures indicate approximately $191 million in futures outflows on Friday, alongside $8.80 million in spot-market outflows. These figures point to reduced exposure, although outflows alone do not establish whether investors are permanently abandoning the asset.
Another bearish signal comes from SOL’s taker buy-to-sell ratio, which reportedly stands near 0.90. A reading below 1 indicates that aggressive market selling exceeds aggressive buying, suggesting sellers are exerting greater influence over short-term trading.
Solana technical outlook: $67.50 at risk
SOL traded near $78.33 in the reported Friday snapshot, extending a decline from above $120 in early October. The token remains well below its major moving averages, reinforcing the broader bearish structure.
The 50-day exponential moving average (EMA), at $97.55, has moved below the 200-day EMA at $98.62. This formation, commonly called a Death Cross, is often interpreted as evidence of weakening medium-term momentum.
SOL has also fallen beneath an ascending trendline near $91.20 that previously provided support. The former support area could now act as resistance during any recovery attempt.
Momentum indicators remain deeply negative. The Relative Strength Index (RSI) is near 19, firmly below the conventional oversold threshold of 30. Meanwhile, the Moving Average Convergence Divergence (MACD) remains below zero, with its signal line around -0.96.
Key technical levels include:
- Immediate support: $77.60.
- Next downside target: $67.50.
- Initial resistance: $87.46.
- Further resistance: $95.82.
- Major moving-average barrier: $97.55–$98.62.
Can SOL recover from oversold levels?
A sustained break below $77.60 could expose Solana to further losses towards $67.50. However, the RSI reading near 19 also indicates that selling has become unusually intense, increasing the possibility of short-term relief buying.
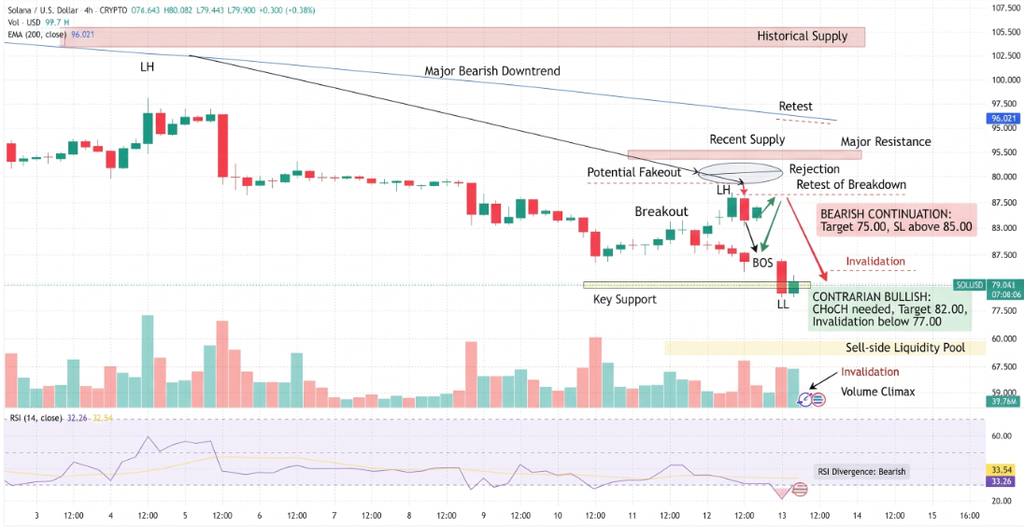
For a recovery to gain credibility, SOL would first need to reclaim $87.46 and then challenge the $95.82 resistance area. A move above the moving-average cluster would provide stronger evidence that bearish momentum is weakening.
Conclusion
Solana remains under significant pressure as liquidations, futures-market weakness and bearish technical signals reinforce one another. Although deeply oversold conditions could produce a temporary rebound, a decisive break below $77.60 would increase the risk of a decline towards $67.50. Until buyers recover key resistance levels, the broader outlook remains bearish.
Sources & Methodology
Primary-source standard: Market-moving facts should link to original data releases, regulator notices, company filings or official project announcements whenever available. Secondary reporting is used for additional context, not as a substitute for original evidence.
Page last reviewed: