
XRP remained under pressure on Friday, trading close to the critical $1.00 level as weakening cryptocurrency sentiment and heavy derivatives liquidations added to selling pressure. The token has struggled to recover since November 5, with broader market concerns, uncertainty surrounding US monetary policy and the reported Binance security incident weighing on risk appetite. Meanwhile, technical indicators point to a firmly bearish trend, leaving the $1.00 threshold as an important area for traders watching the next move.
XRP liquidations deepen selling pressure
Data from CoinGlass showed more than $20 million in XRP liquidations over 24 hours, with long positions accounting for most of the losses. Short liquidations totalled approximately $1.2 million, according to the figures supplied in the report. The imbalance indicates that traders betting on higher prices faced greater forced closures during the latest decline.
Liquidations occur when exchanges automatically close leveraged positions after traders’ margin balances become insufficient to support them. When long positions are liquidated during a falling market, the resulting selling can add to downward pressure and accelerate price movements.
Broader sentiment remains weak. The Crypto Fear & Greed Index stood at 20, in the Extreme Fear category, compared with 28 a day earlier. The reading reflects widespread caution across digital assets, although it is a sentiment measure rather than a direct indicator of XRP’s future price.
Macroeconomic uncertainty has also affected demand for risk-sensitive assets. The latest US inflation figures and expectations of a possible December Federal Reserve rate increase have kept investors focused on borrowing costs and liquidity conditions. A rate increase, however, remains a market expectation rather than a confirmed policy decision.
XRP technical outlook remains bearish
XRP is trading below its major exponential moving averages (EMAs), suggesting that sellers retain control across several timeframes. The 10-day SuperTrend indicator stands near $1.19, while the 50-day EMA is around $1.26. Additional resistance appears at the descending trendline near $1.27.
The broader moving-average structure adds to the bearish picture:
- $1.19: Initial recovery barrier at the SuperTrend indicator.
- $1.26–$1.27: Resistance from the 50-day EMA and descending trendline.
- $1.29: 100-day EMA resistance.
- $1.34: 200-day EMA, a longer-term recovery hurdle.
The Relative Strength Index (RSI) stands near 22, well below the conventional 30 threshold for oversold conditions. This signals intense selling momentum, but it can also leave room for a temporary rebound. Oversold readings alone do not confirm that a durable bottom has formed.
The Moving Average Convergence Divergence (MACD) remains below zero, reinforcing the negative momentum outlook.
$1.00 support becomes critical for XRP
The $1.00 level is the immediate price area in focus. A sustained break below it could expose XRP to further losses, although the supplied technical data does not identify a reliable lower support target.
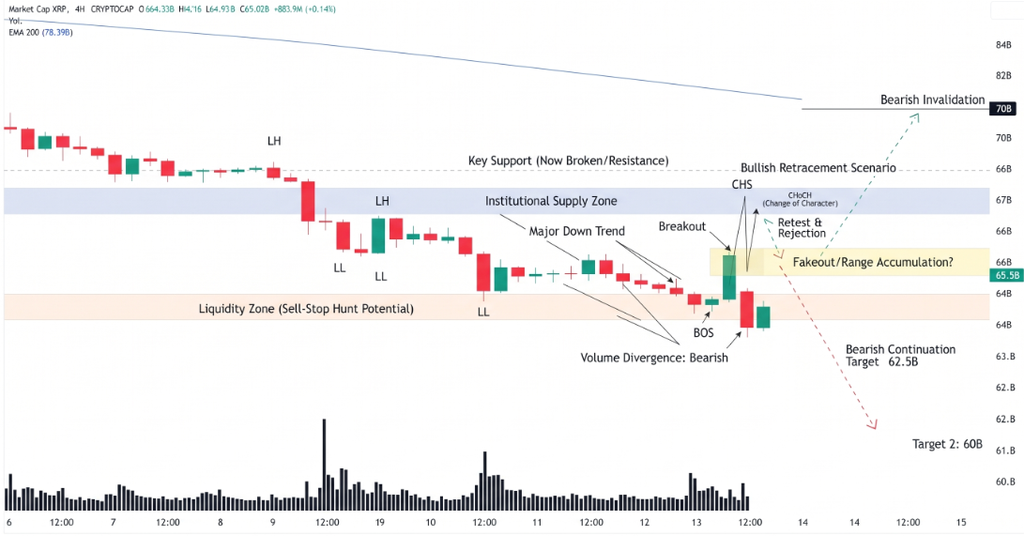
On the upside, a daily close above $1.19 would provide an initial indication that selling pressure is easing. Further recovery would still face resistance between $1.26 and $1.34, where several technical indicators converge.
Conclusion
XRP faces a fragile outlook as liquidations, extreme market fear and bearish technical signals weigh on demand. Holding $1.00 could provide a temporary base, but a sustained recovery requires stronger momentum and a move above $1.19. Until then, downside risks remain elevated.
Sources & Methodology
Primary-source standard: Market-moving facts should link to original data releases, regulator notices, company filings or official project announcements whenever available. Secondary reporting is used for additional context, not as a substitute for original evidence.
Page last reviewed: