
Solana (SOL) recovered above $75 on Wednesday after gaining more than 5% a day earlier, supported by renewed demand for US spot Solana exchange-traded funds (ETFs) and stronger sentiment following Nvidia’s latest earnings report. The funds attracted $11.68 million on November 16, their first positive daily flow in several weeks. However, the rebound faces challenges: ETF flows turned neutral the following day, while futures open interest continued to decline. Technical indicators remain bearish despite signs that selling pressure may be easing.
Solana rebounds as ETF demand returns
SOL climbed approximately 5% on Tuesday, November 17, recovering from recent losses and trading near $75 on Wednesday. The move followed $11.68 million in net inflows into US spot Solana ETFs on November 16, according to ETF flow data. It was the first positive daily total since October 21, suggesting that some institutional investors may be returning to the market.
The improvement remains tentative. The funds recorded no net inflows on November 17, indicating that the latest buying interest has not yet developed into a consistent trend. ETF flows can provide insight into investor demand, but a single positive session does not establish a lasting change in institutional positioning.
Broader market sentiment also received support from Nvidia’s third-quarter results. The chipmaker reported revenue of $115.8 billion, up 103% from a year earlier and 20% from the previous quarter. Strong results from a major technology company can improve risk appetite across financial markets, although they do not directly determine Solana’s price.
Falling futures open interest raises caution
Despite the price recovery, Solana’s derivatives market offers a less encouraging signal. CoinGlass data cited in the market snapshot shows futures open interest falling to 54.33 million SOL from 62.79 million SOL a week earlier.
Open interest measures the number of outstanding futures contracts. A decline can indicate that traders are closing positions or reducing leverage. While this may ease the risk of further forced liquidations, it also suggests that speculative participation has weakened.
The conflicting signals leave SOL’s recovery vulnerable:
- ETF inflows: $11.68 million on November 16.
- Next session: No net ETF inflows on November 17.
- Futures open interest: Down to 54.33 million SOL from 62.79 million.
- Recent rebound: More than 5% on November 17.
A renewed wave of ETF outflows or another broad cryptocurrency sell-off could undermine the recovery.
SOL forecast: $67.50 support remains key
Solana trades near $75.06 in the supplied Wednesday market snapshot, following a rebound from the $67.50 support area tested on Sunday. The broader trend remains bearish after a 16% weekly decline and six consecutive bearish weekly closes.
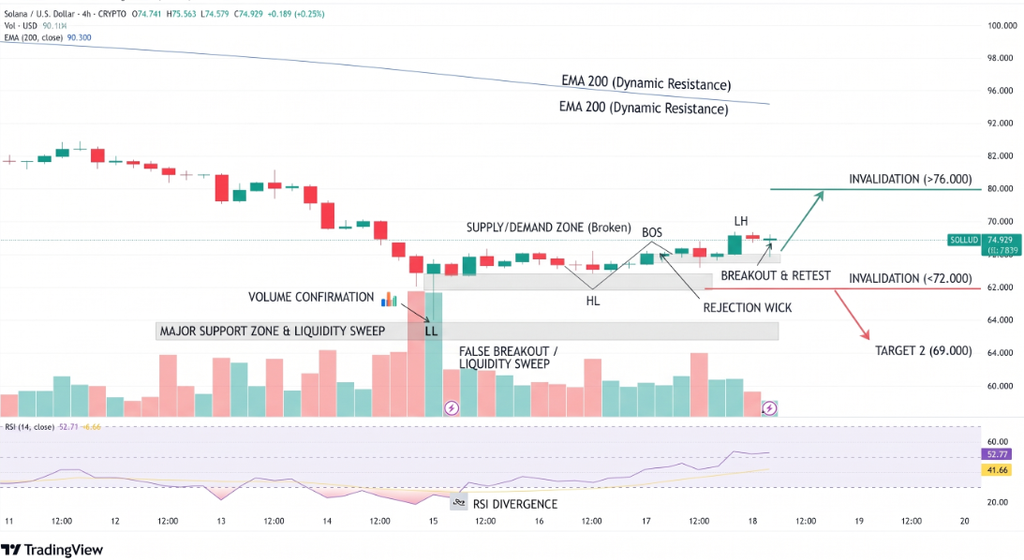
SOL remains below its 50-day and 200-day Exponential Moving Averages, near $93.11 and $96.46, respectively. The Relative Strength Index at 28 signals oversold conditions, while the negative MACD confirms that bearish momentum remains dominant, although its weakening negative profile suggests selling pressure may be moderating.
Initial resistance stands at $77.60, followed by $87.46 and $95.82. The moving averages near $93.11 and $96.46 create an additional resistance zone. On the downside, $67.50 is the immediate support, with $60.13 representing a deeper potential floor.
Conclusion
Solana’s return above $75 and the $11.68 million ETF inflow offer early signs of improving demand, but declining open interest and the absence of follow-through ETF buying leave the recovery unconfirmed. Holding above $67.50 would help buyers preserve the rebound, while a break below it could expose $60.13. A sustained move above $77.60 would provide the first meaningful indication that bullish momentum is strengthening.
Sources & Methodology
Primary-source standard: Market-moving facts should link to original data releases, regulator notices, company filings or official project announcements whenever available. Secondary reporting is used for additional context, not as a substitute for original evidence.
Page last reviewed: