
Chainlink (LINK) is attempting to recover above $9.00 on Wednesday after defending support near $8.60 during last weekend’s sharp sell-off. The token remains under pressure, however, as institutional investment products record further withdrawals and its price trades well below key moving averages. LINK recently changed hands near $9.29, down roughly 9% over seven days. Unless buyers establish stronger demand, the next significant downside level remains around $7.00.
Chainlink ETF outflows weigh on sentiment
Institutional demand for Chainlink remains subdued. US spot LINK exchange-traded funds recorded approximately $1.33 million in net outflows on November 17, marking a third consecutive trading day of withdrawals. The funds also registered about $3.4 million in net outflows over the past week, according to ETF flow data.
The latest withdrawals add pressure to a market already dealing with weaker prices. Cumulative inflows into the products remain positive at roughly $174 million, but recent redemptions indicate that some investors are reducing exposure rather than increasing positions during the downturn.
Derivatives activity presents a more mixed picture. CoinGlass data placed aggregate LINK futures open interest near $390 million on Wednesday, with the figure marginally higher over 24 hours. Open interest measures the value of outstanding futures contracts and helps show how much capital remains committed to leveraged positions.
Spot and futures flows have also shown signs of buying interest. However, short-term inflows alone do not confirm a sustained recovery, particularly while ETF demand remains weak and the broader market is under pressure.
LINK technical outlook remains bearish
LINK trades below its major moving averages, leaving the broader technical structure tilted toward sellers. The supplied chart places the 200-day Exponential Moving Average (EMA) near $10.89 and the 50-day EMA around $11.09. Both levels form a resistance band that bulls must reclaim to improve the outlook.
Momentum indicators show that selling pressure may be easing, but a reversal is not yet confirmed. The Moving Average Convergence Divergence (MACD) line is rising while remaining below zero, suggesting bearish momentum is moderating. Meanwhile, the Relative Strength Index (RSI) has recovered to around 34, close to oversold territory.
A sustained move above $10.87 would provide the first indication of improving demand. A stronger recovery through the moving-average cluster could expose resistance at $12.40 and then $15.53.
Key Chainlink support levels to watch
The $8.60 area remains the immediate downside threshold. LINK recently found buyers around this zone, making it important for maintaining the current recovery attempt.
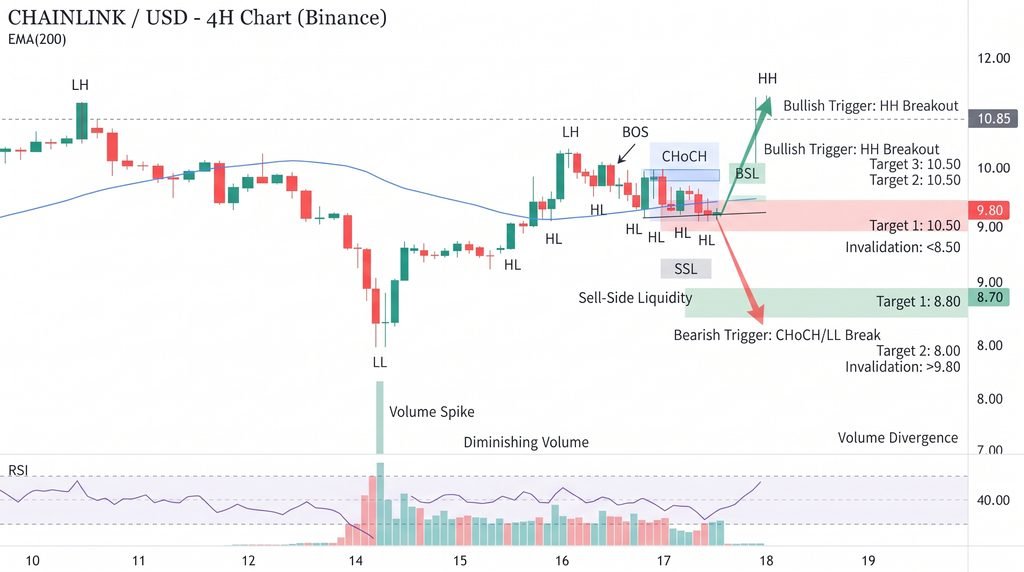
If sellers push the token below that floor, the next major support sits near $7.01. A move toward this level would extend the recent decline and signal that buyers have failed to defend the latest support.
Key levels include:
- Immediate support: $8.60.
- Major downside target: $7.01.
- First resistance: $10.87.
- Moving-average resistance: $10.89–$11.09.
Conclusion
Chainlink remains vulnerable as ETF withdrawals and its position below major moving averages weigh on sentiment. Holding $8.60 could allow a recovery attempt, but a break below it would expose the $7.01 region. Buyers need to reclaim the $10.87–$11.09 resistance zone to establish a more convincing bullish reversal.
Sources & Methodology
Primary-source standard: Market-moving facts should link to original data releases, regulator notices, company filings or official project announcements whenever available. Secondary reporting is used for additional context, not as a substitute for original evidence.
Page last reviewed: