
Gold is currently trading at $2,517.97, showing a slight gain of 0.04% for the day. The price action is moving within a bullish channel, supported by the 50-period EMA at $2,510.35 on the 2-hour chart. Gold has managed to stay above key support at $2,511.02, with potential for further gains if upcoming economic data aligns with market expectations.
CPI Data Drives Market Sentiment
Recent inflation data has played a crucial role in shaping market sentiment. The latest Core CPI (m/m) came in at 0.3%, slightly above the expected 0.2%, while the CPI m/m remained steady at 0.2%. On a yearly basis, the CPI y/y dropped to 2.5%, down from 2.9% in July, indicating cooling inflation.
This decline in inflation has boosted speculation that the Federal Reserve might adopt a more dovish stance, potentially leading to a rate cut in the coming months. Lower interest rates typically weaken the U.S. Dollar, making gold more attractive as a safe-haven asset. The likelihood of such a move is currently fueling gold’s upward trajectory as traders eye key resistance levels.
Upcoming Economic Events in Focus
Looking ahead, traders are preparing for today’s Core PPI (m/m) and PPI (m/m) releases, both forecasted at 0.2% and 0.1%, respectively. These inflation indicators will provide insight into producer-level price changes, further influencing Fed decisions. Additionally, Unemployment Claims, expected to remain at 227K, will also be closely monitored for signs of labor market strength or weakness.
If the PPI data suggests lower inflationary pressures, it could reinforce expectations for a rate cut, potentially pushing gold prices higher. Conversely, stronger-than-expected data may temper the Fed’s dovish outlook, leading to short-term gold price corrections.
Technical Outlook for Gold
Gold’s immediate resistance lies at $2,529.33. A breakout above this level could drive prices toward $2,538.27, with a further push possible to $2,547.64. On the downside, failure to break through the $2,529 level could lead to a pullback, with support at $2,511.02 and further declines potentially testing $2,501.22.
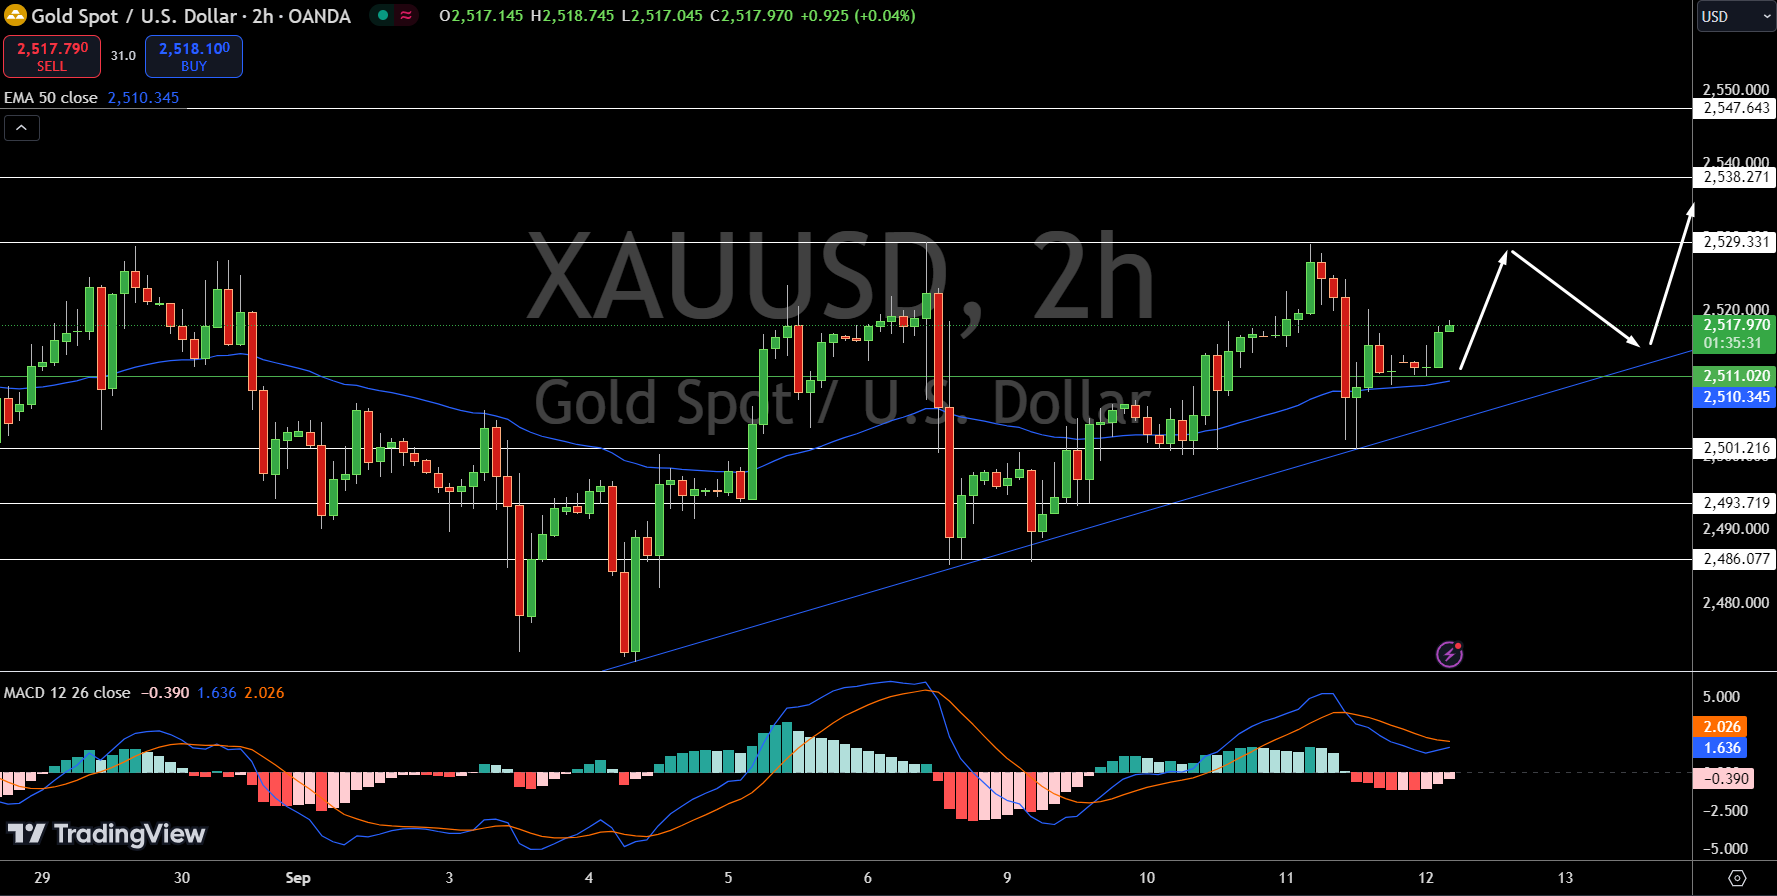
The MACD indicator currently shows signs of a potential bullish crossover, with the MACD line at -0.39 and the signal line at 2.026. While this hints at possible buying momentum, traders should remain cautious and wait for a clear breakout above resistance levels before entering long positions.
Conclusion: Cautiously Bullish Outlook
Gold remains at a critical juncture, supported by favorable economic conditions, such as cooling inflation and dovish Fed expectations. Traders should closely monitor the PPI and Unemployment Claims data for further guidance.
A breakout above $2,529 could signal further gains, but failure to breach resistance might trigger a corrective move toward $2,511. Keep an eye on technical indicators like the MACD for early signs of market momentum.