
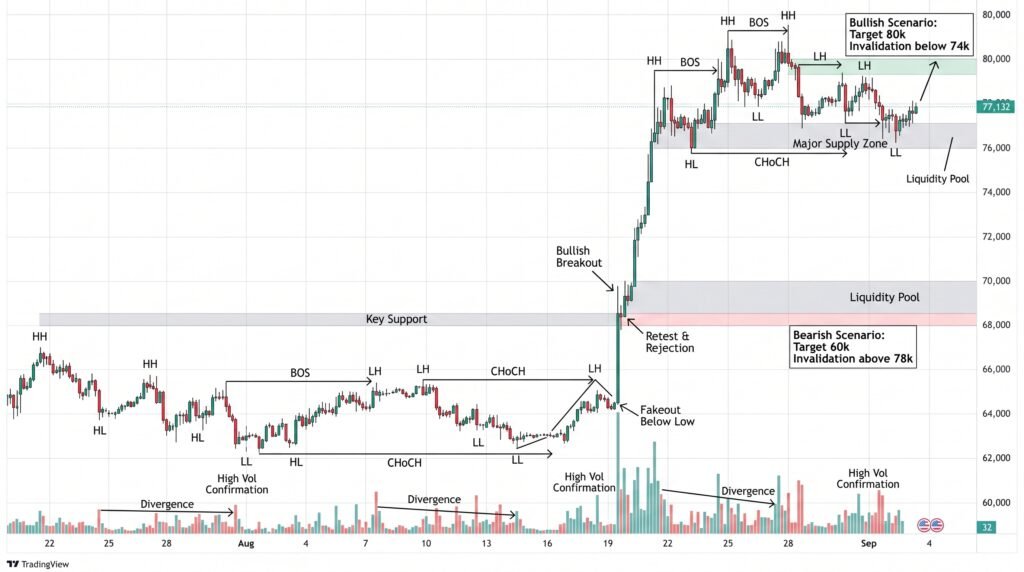
The Bitcoin price remains locked in a narrow range near $78,000, leaving traders without a clear short-term direction. On the five-hour chart, BTC is positioned inside the Ichimoku Cloud, a technical indicator used to identify trend direction, momentum and potential support or resistance.
Recent market data puts Bitcoin around the $77,800-$78,000 area, broadly consistent with the consolidation described in the technical setup. CoinGecko data showed BTC near $77,700 on September 3, while historical data from Yahoo Finance placed the Sept. 3 trading range around $77,310 to $77,845 during the session.
The cloud is important because trading inside it often reflects a market without a confirmed trend. Bitcoin’s price has also been moving with broader financial conditions. U.S. Treasury yields eased on Thursday as investors awaited the latest employment data, while markets continued to price a substantial probability of a September Federal Reserve rate increase.
The technical indicators described in the five-hour setup reinforce that uncertainty. The average true range, or ATR, is around 886 points, showing that an $800-$1,000 intraday move remains realistic. Meanwhile, an RSI near 50 suggests momentum is balanced rather than strongly overbought or oversold.
$76,500 and $79,000 set boundaries
The immediate trading range is defined by support near $76,500-$77,000 and resistance around $78,800-$79,200. Those levels are more important than small moves within the middle of the cloud because a breakout would provide a clearer signal on direction.
A sustained move above $79,000 would push BTC above the upper part of the cloud and strengthen the bullish case. It would also shift attention toward higher resistance levels that could determine whether the recent recovery can develop into a larger trend.
A break below $76,500, by contrast, would weaken the structure and increase the probability of a deeper correction. The supplied technical model identifies $72,350 as the first major downside target, followed by levels near the 200-day moving average and $65,000.
Key technical levels include:
- Current zone: Around $78,000
- Support: $76,500-$77,000
- Resistance: $78,800-$79,200
- Major downside targets: $72,350, $68,790 and $65,000
Bitcoin remains well above its 200-period simple moving average near $68,790 in the supplied five-hour framework, meaning the larger trend has not been invalidated by the recent pullback. However, short-term momentum remains less convincing because the MACD has turned bearish while the RSI remains close to neutral.
Macro data could trigger the move
Technical signals are developing at the same time as major macroeconomic catalysts. The U.S. labor market is the immediate focus, with investors waiting for the U.S. nonfarm payrolls report after weaker private payroll growth raised questions about the strength of hiring.
The ADP report showed U.S. private employers added 38,000 jobs in August, below expectations. At the same time, markets were pricing around a 62% probability of a 25-basis-point Federal Reserve rate increase in September, according to Reuters’ latest market coverage.
That combination matters for Bitcoin. Lower Treasury yields and a softer dollar can improve conditions for risk assets, while stronger employment data could reinforce higher-rate expectations and put renewed pressure on cryptocurrencies.
Bitcoin also remains sensitive to geopolitical developments. Renewed U.S.-Iran military activity has added uncertainty across global markets, although the broader risk environment improved somewhat on Thursday as equities and bonds recovered.
The result is a market waiting for confirmation. Bitcoin has no clear edge while it remains inside the cloud. The next decisive move is likely to come from either a break above $79,000 or a sustained move below $76,500.
Conclusion
Bitcoin remains in a defined consolidation range, with the Ichimoku Cloud showing that neither buyers nor sellers have established control. The critical levels are $76,500 on the downside and $79,000 on the upside. A breakout above resistance would strengthen the recovery and open the way toward higher levels, while a break below support could expose $72,350 and deeper targets. The technical picture is being reinforced by macroeconomic uncertainty, particularly Federal Reserve policy, Treasury yields and Friday’s U.S. employment report. Until one boundary breaks, patience remains more reliable than chasing moves inside the cloud.
Sources & Methodology
Primary-source standard: Market-moving facts should link to original data releases, regulator notices, company filings or official project announcements whenever available. Secondary reporting is used for additional context, not as a substitute for original evidence.
Page last reviewed: