
Cardano (ADA) is consolidating near $0.255 on Monday, September 28, after gaining roughly 11% over the previous week. Current market data puts ADA near $0.254, with its market capitalization around $9.4 billion and futures open interest close to $600 million.
The recovery has pushed ADA back above $0.25 after the token closed near $0.196 on September 16. However, the latest derivatives and on-chain readings suggest traders are becoming more selective as the rally approaches resistance.
The setup is therefore mixed: price structure remains constructive above several moving averages, but positioning and overheating indicators could limit the pace of further gains.
Derivatives signals remain divided
Data from CoinGlass shows substantial activity in ADA futures, with recent 24-hour futures volume above $450 million and open interest around $600 million.
The source data cited in the market analysis shows ADA’s long-to-short ratio at 0.63, indicating that short positions outweighed long positions in that reading. A ratio below 1 generally means more accounts are positioned short than long.
At the same time, the funding rate turned positive on September 17 at 0.0050%. Positive funding means long-position holders pay short-position holders, normally indicating that demand for leveraged long exposure has increased. Historical Binance data also confirms positive ADA funding around September 17.
That creates a notable divergence:
- Long-to-short positioning remains cautious.
- Positive funding indicates demand for long exposure.
- Futures open interest remains substantial near $600 million.
ADA technical outlook near $0.299
From a technical perspective, ADA remains above the key moving averages cited in the current setup. The 50-day EMA stands near $0.215, the 100-day EMA around $0.209, and the 200-day EMA near $0.239. Holding above these levels keeps the broader recovery structure intact.
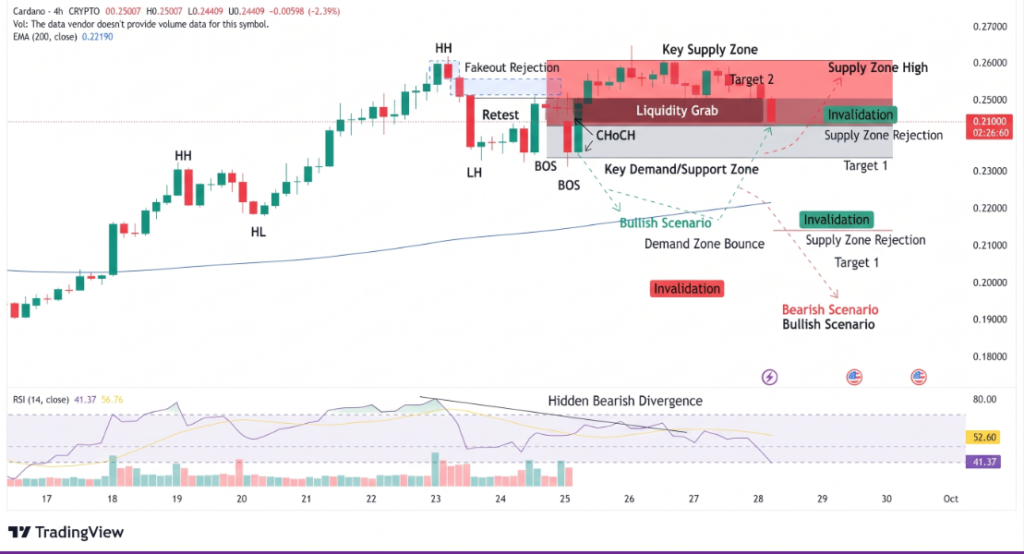
Momentum, however, has moderated. Current technical readings place the RSI around neutral territory, while the moving-average picture remains mixed. Investing.com’s September 28 snapshot showed RSI near 49.3 and the 200-day moving average around $0.244, illustrating that short-term momentum has cooled even as longer-term averages provide support.
The main support area remains around $0.236, followed by the 200-day EMA near $0.239. Below that, ADA could find support around the 50-day EMA at $0.215 and the 100-day EMA at $0.209.
On the upside, $0.299 remains the major resistance level from the supplied technical structure. A sustained move through that zone would put the recent recovery under a stronger technical test, while failure to hold $0.236 would weaken the current setup.
Conclusion
Cardano’s latest rally has restored ADA above $0.25, but the market has not yet produced a clear directional signal. Derivatives positioning remains cautious, while positive funding and elevated futures activity show continued interest from leveraged traders. With ADA near $0.255, the $0.236 support zone and $0.299 resistance level are the key technical areas to watch as the market determines whether the recovery can extend.
Sources & Methodology
Primary-source standard: Market-moving facts should link to original data releases, regulator notices, company filings or official project announcements whenever available. Secondary reporting is used for additional context, not as a substitute for original evidence.
Page last reviewed: