
Crude oil inventories fell by 1.6 million barrels in the latest data release, sharply exceeding expectations of a 0.2 million barrel drop. This significant inventory drawdown has provided underlying support for oil prices, even as WTI Crude Oil (USOIL) continues to trade cautiously.
As of today, WTI is priced at $70.55, down 0.28%, but still within an ascending channel on the 4-hour chart. The recent inventory data, coupled with global supply concerns, has kept traders focused on the oil market’s near-term prospects.
Key Support Levels and Immediate Resistance
WTI Crude Oil has maintained its bullish structure, supported by the 50-period Exponential Moving Average (EMA) at $69.52. This EMA has been a key dynamic support level, helping to uphold the positive trend despite today’s minor pullback. Oil prices are now approaching the upper boundary of their ascending channel, with immediate resistance located at $71.38.
A decisive break above this resistance level could accelerate buying pressure, potentially driving prices toward the next key target at $72.93.
If momentum continues, a more extended move could push WTI to $74.19, marking a significant gain for the commodity. However, failure to break through $71.38 could result in a period of consolidation or even a pullback, with $68.24 as a critical support level.
MACD Signals Upward Momentum
The Moving Average Convergence Divergence (MACD) indicator is currently in positive territory, further signalling the possibility of sustained upward momentum. This is a key bullish indicator, suggesting that oil prices could continue to rise, especially if broader market sentiment remains favourable.
However, traders should remain cautious. The ascending channel’s boundaries are crucial markers, and a break below the 50-period EMA at $69.52 could signal the beginning of a short-term correction.
If prices fall below this level, it may pave the way for further declines, with immediate support near $68.24.
Market Outlook: Crude Oil Inventories and Global Supply Concerns
The recent drawdown in U.S. crude oil inventories by 1.6 million barrels reflects a tightening supply scenario, which has contributed to keeping oil prices relatively buoyant.
Additionally, OPEC+ production cuts continue to be a significant factor in the market, as member countries maintain lower output levels to support prices amid global demand fluctuations.
Looking ahead, the market will keep a close eye on future inventory reports and global supply dynamics.
Any further tightening of inventories or unexpected supply disruptions could lead to higher prices, while a stabilization in supply might put a cap on significant price gains.
Conclusion: Key Levels to Watch
For now, WTI Crude Oil remains in a bullish trend, supported by the 50-period EMA at $69.52. Traders should closely monitor the $71.38 resistance level. A break above could open the door to further gains, while a failure to clear this level may result in a consolidation phase or a potential pullback toward $68.24.
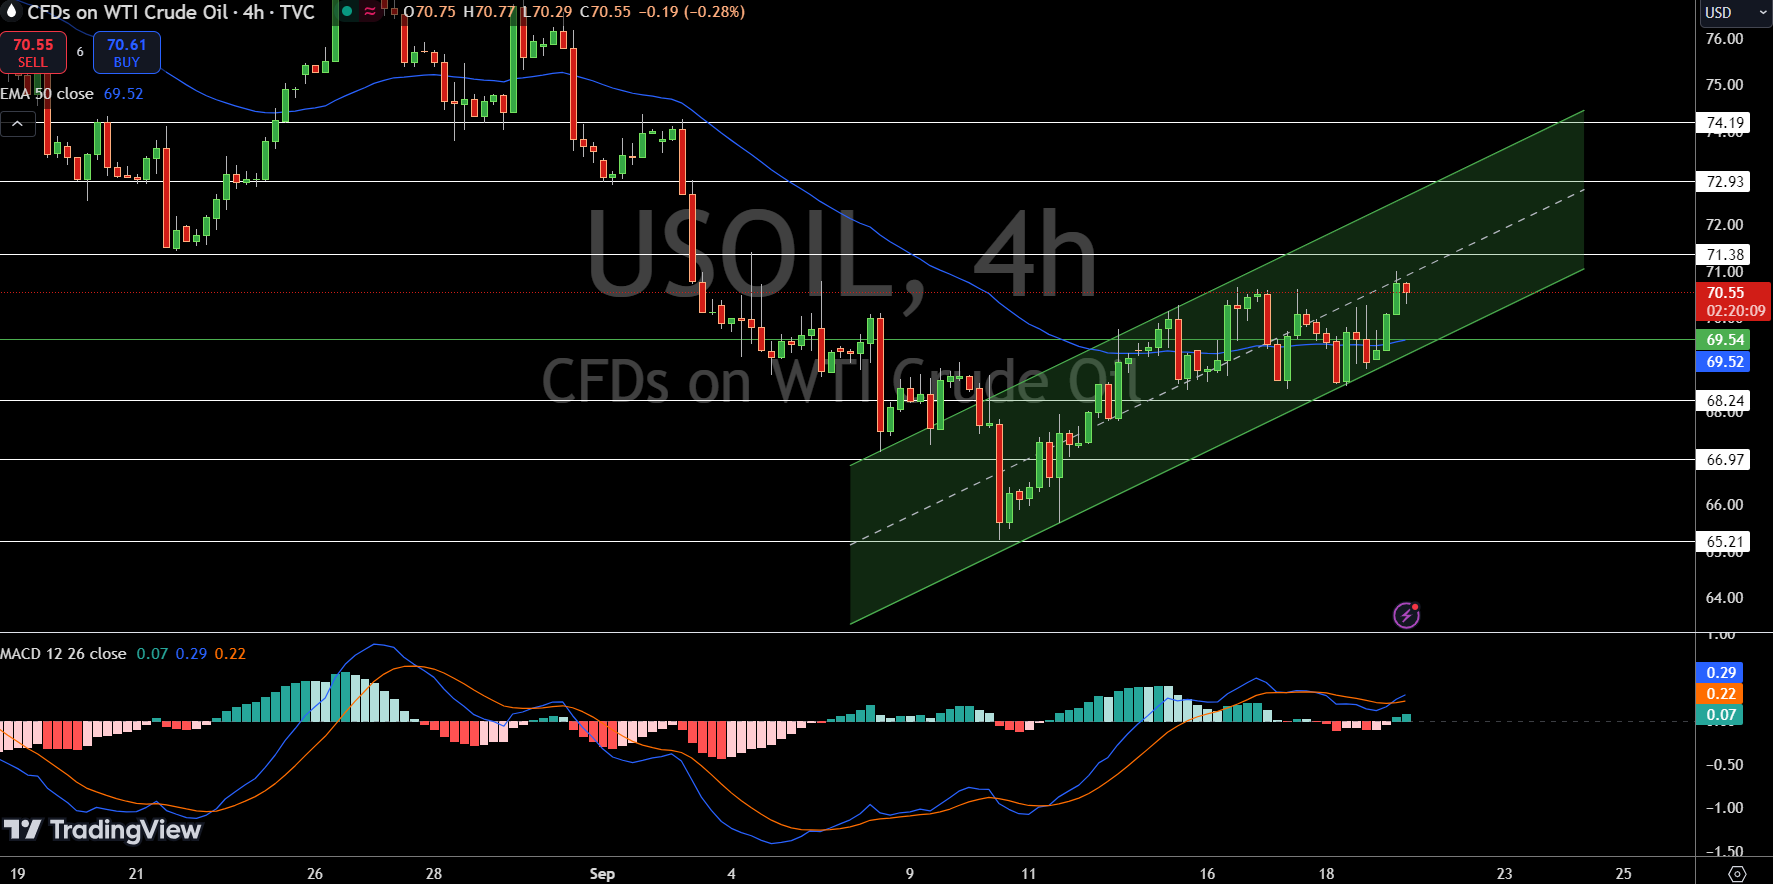
The MACD remains in positive territory, reinforcing the bullish outlook, but caution is warranted as market dynamics continue to evolve.
Key Insights:
- Inventory drawdown: 1.6 million barrels, exceeding expectations.
- 50-period EMA: Strong support at $69.52, maintaining bullish momentum.
- MACD positive: Signaling upward momentum, but watch for key resistance levels.
Read more about Gold and Silver price forecasts here.
Sources & Methodology
Primary-source standard: Market-moving facts should link to original data releases, regulator notices, company filings or official project announcements whenever available. Secondary reporting is used for additional context, not as a substitute for original evidence.
Page last reviewed: