
Gold (XAU/USD) continues its bullish streak, currently trading at $2,587.97 with a 0.11% increase on the day. The market is closely watching key data releases, including U.S. unemployment claims and existing home sales, which could further influence gold’s trajectory in the short term.
Strong Support at $2,555 Boosts Gold Prices
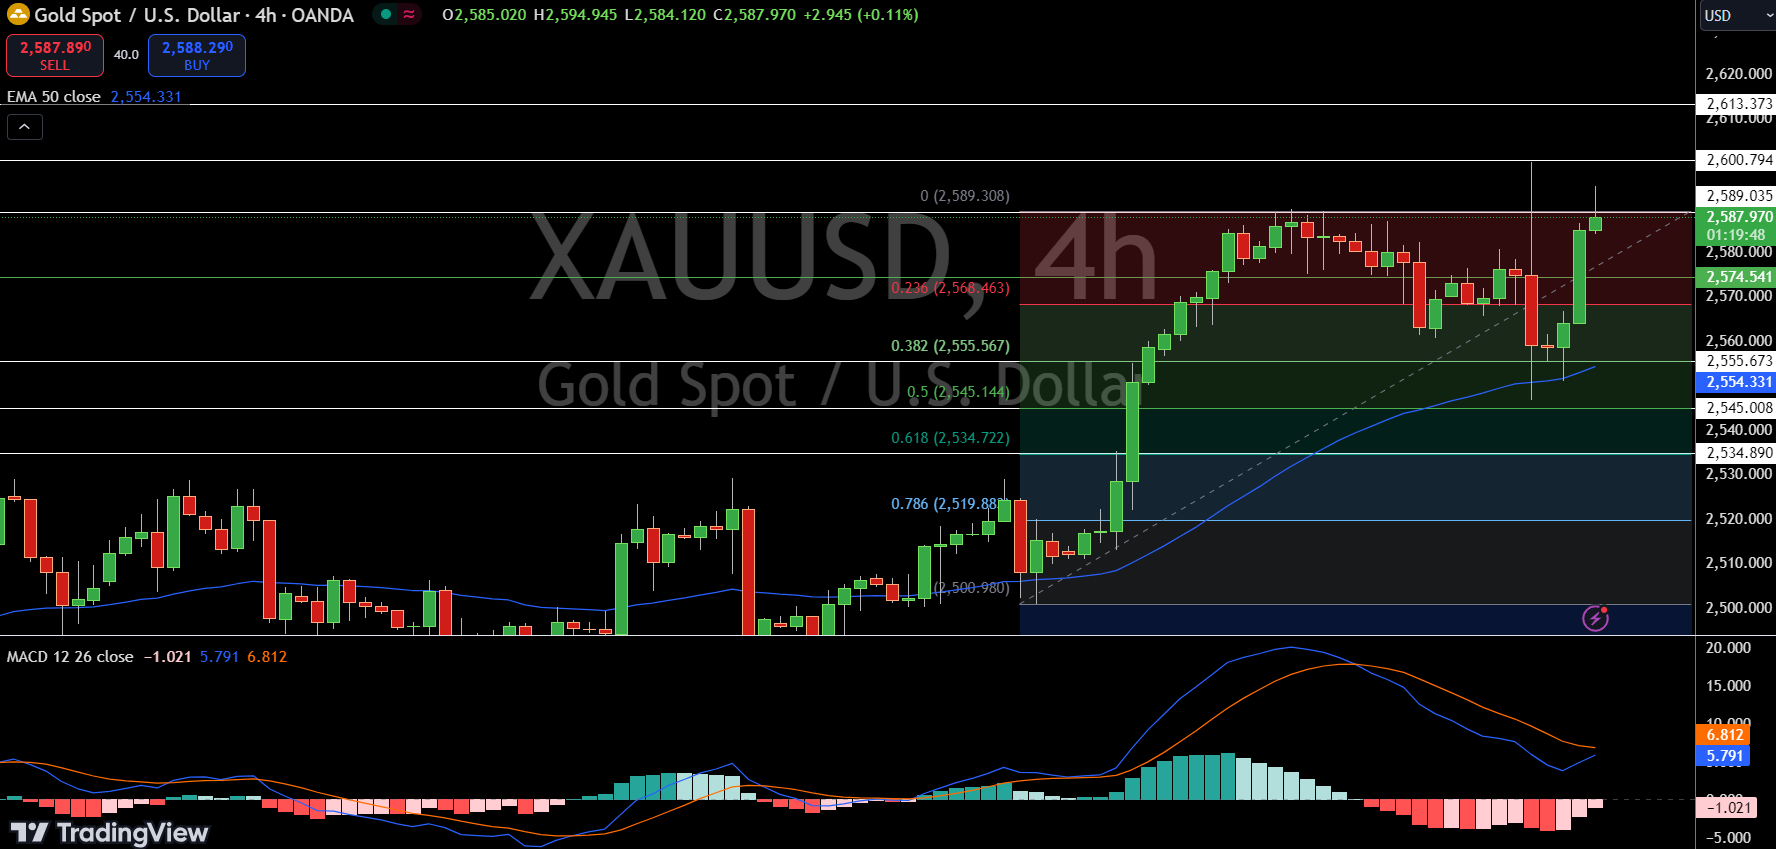
Gold has found solid support near its Fibonacci 0.382 retracement level, located at $2,555.67. This level has helped maintain the precious metal’s upward momentum, bolstered by the 50-period Exponential Moving Average (EMA) sitting at $2,554.33. These technical indicators suggest a favorable environment for buyers as long as prices remain above this zone.
- Fibonacci Support: The 0.382 retracement level at $2,555.67 has acted as a key cushion, reinforcing bullish sentiment.
- 50-period EMA: Dynamic support around $2,554.33 continues to hold strong, pointing to sustained upward movement.
Immediate resistance is now being tested at $2,589.30, a critical point that coincides with the upper boundary of the Fibonacci retracement zone. A decisive break above this resistance level could pave the way for further gains, with gold eyeing the next key levels at $2,606.79 and $2,613.37.
MACD Bullish as RSI Approaches Overbought Zone
Technical indicators further support gold’s bullish outlook. The Moving Average Convergence Divergence (MACD) indicator is in bullish territory, with the MACD line crossing above the signal line, indicating that upward momentum is likely to persist. However, caution is warranted as the Relative Strength Index (RSI) nears overbought levels, suggesting a possible cooling in the rally.
- MACD: Bullish crossover signals continued upward momentum.
- RSI: Approaching overbought territory, hinting at potential short-term exhaustion.
Traders should keep an eye on any RSI divergence, which could signal a short-term correction.
Market Events to Watch
Several key U.S. economic events could impact gold prices in the coming days. On Thursday, unemployment claims are expected to hold steady at 230K, while the Philly Fed Manufacturing Index is forecasted to improve to -0.8 from -7.0. Additionally, existing home sales data will be released, with forecasts predicting 3.92 million units sold, slightly below expectations of 3.95 million.
These events may influence the U.S. dollar, which has an inverse relationship with gold prices. Any signs of economic weakening could further bolster gold as a safe-haven asset.
Conclusion: Gold Eyes $2,606 Amid Bullish Sentiment
In summary, the technical outlook for gold remains bullish as long as prices stay above $2,554.33. A break above the $2,589.30 resistance level could accelerate gains toward $2,606.79 and beyond.
However, traders should monitor the RSI closely, as overbought conditions may signal a short-term pullback. Keep an eye on U.S. economic data, as it could provide further direction for gold in the coming sessions.
Key Insights:
- Fibonacci and EMA support: Key zones at $2,555.67 and $2,554.33 continue to hold.
- MACD bullish: Strong momentum, though RSI suggests caution.
- Market events: U.S. unemployment claims and home sales data may impact gold’s movement.
Read more about gold and silver price forecasts here.
