
Gold remains under pressure after a sharp selloff, with the supplied five-hour chart identifying $4,310 as a key support level. The technical setup shows weakening momentum, while the RSI at 38.73 is approaching oversold territory. However, current market data shows spot XAU/USD trading closer to $4,280–$4,290 on Sept. 24 after falling 1.53% on Sept. 23. The immediate question is whether buyers can stabilize the decline or whether deeper support levels come into play.
Gold Sellers Keep Control
The five-hour technical structure remains bearish. In the supplied setup, gold was trading near $4,318.20 while holding just above the $4,310 support area. Since then, spot gold has moved below that reference, with Sept. 24 trading data showing an intraday range of roughly $4,274 to $4,303.
The MACD reading of -16.26 against a signal line of -8.47 indicates negative momentum in the original chart setup. Price was also below the 200-period simple moving average at $4,419.67 and beneath the Ichimoku Cloud around $4,366–$4,376.
- Key support: $4,310
- Next downside area: $4,260
- Major lower reference: $4,126
- Psychological level: $4,000
The broader fundamental backdrop has also turned less supportive. Reuters reported that expectations for additional Federal Reserve rate increases, a firmer dollar and higher energy prices have weighed on gold.
$4,310 Breakdown Raises Risk
A sustained move below $4,310 support would strengthen the bearish technical structure and bring the $4,260 region into focus. That level is particularly important because it sits close to recent price lows and a broader Fibonacci retracement reference.
If sellers push through $4,260, the supplied chart identifies $4,126 as the next major downside level. The $4,000 mark would represent a deeper psychological support area rather than a confirmed technical target.
The RSI at 38.73 provides an important counterpoint. Although the indicator is below the neutral 50 threshold, it has not reached the traditional 30 level associated with oversold conditions. A falling RSI therefore confirms weakening momentum but does not, by itself, establish a reversal.
Bounce Risk Meets Bearish Structure
Gold’s proximity to the lower Bollinger Band, listed near $4,302 in the original setup, leaves room for a short-term rebound. Such a move would become more technically significant if buyers reclaim the $4,366–$4,376 Ichimoku area and then challenge the $4,408 region.
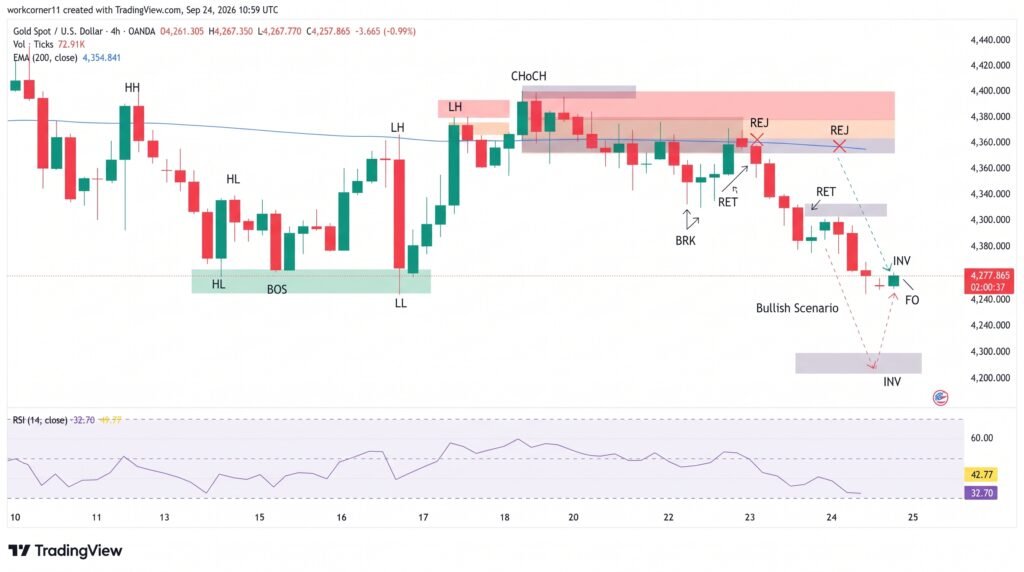
The $4,350–$4,408 area therefore remains an important recovery zone. Until gold can regain that cluster, rallies could continue to face resistance from the prevailing downward structure.
The current volatility also requires caution. The supplied ATR reading of 35.28, or roughly 0.8%, indicates that relatively large intraday moves remain possible.
Conclusion:
Gold’s technical structure remains weak, but the approach toward oversold conditions creates room for short-term stabilization. The $4,310 level has become a key reference, with $4,260 and $4,126 representing deeper support areas if selling persists. On the upside, reclaiming $4,350 and then the $4,366–$4,408 region would provide stronger evidence that downside momentum is easing. Until those levels are recovered, the technical bias remains vulnerable to further selling.
Sources & Methodology
Primary-source standard: Market-moving facts should link to original data releases, regulator notices, company filings or official project announcements whenever available. Secondary reporting is used for additional context, not as a substitute for original evidence.
Page last reviewed: