
Gold remains under pressure after retreating sharply from its recent $4,755 peak, with the 5-hour chart showing price consolidating around the $4,365 area. The setup is important because the metal is testing a key Fibonacci retracement zone while trading below major moving averages.
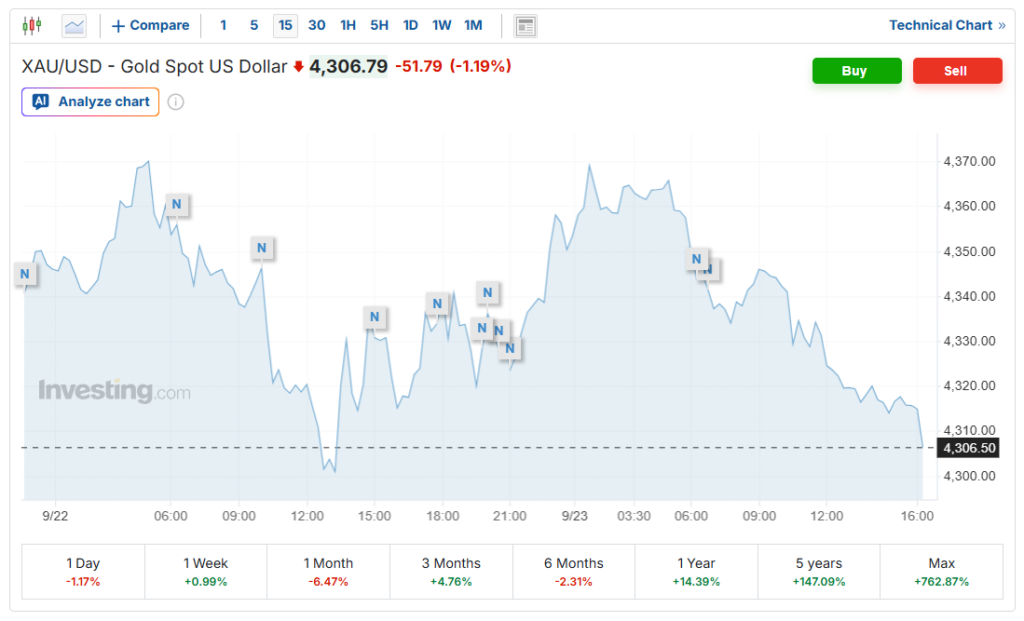
Current market data shows spot XAU/USD trading in the $4,333–$4,344 area on September 23, confirming that the broader decline has continued beyond the $4,365 level cited in the original setup.
The recent weakness has also been tied to expectations for a prolonged period of restrictive U.S. monetary policy. Reuters reported that gold fell as traders increased bets on higher-for-longer interest rates, while the stronger dollar added another headwind for the metal.
Bearish Signals Keep Pressure High
The 5-hour technical structure remains vulnerable while gold trades beneath the 200-period Simple Moving Average (SMA) near $4,412.51. The original chart setup places the 50% Fibonacci midpoint around $4,355.20, creating a narrow support zone close to current prices.
The MACD and SuperTrend indicators continue to point toward negative momentum, although the Money Flow Index suggests selling pressure has not completely eliminated buying interest.
Recent technical data from Investing.com also shows a Strong Sell reading for gold, with its listed moving averages and technical indicators tilted to the sell side.
Key levels from the setup are:
- $4,355.20: 50% Fibonacci support
- $4,300: Structural support tested multiple times
- $4,260: Potential downside objective
- $4,435: Major resistance near the 200-SMA/Trend cluster
- $4,150: Deeper target if bearish momentum accelerates
The ATR near $38.93 indicates that recent volatility has contracted relative to the size of the preceding decline. A volatility expansion could therefore become important if price breaks out of the current consolidation.
$4,435 Caps Any Recovery
Gold’s immediate recovery challenge sits near $4,435, where the 200-period SMA and SuperTrend resistance create a significant technical barrier. A sustained move above this area would weaken the immediate bearish structure and bring higher resistance levels back into consideration.
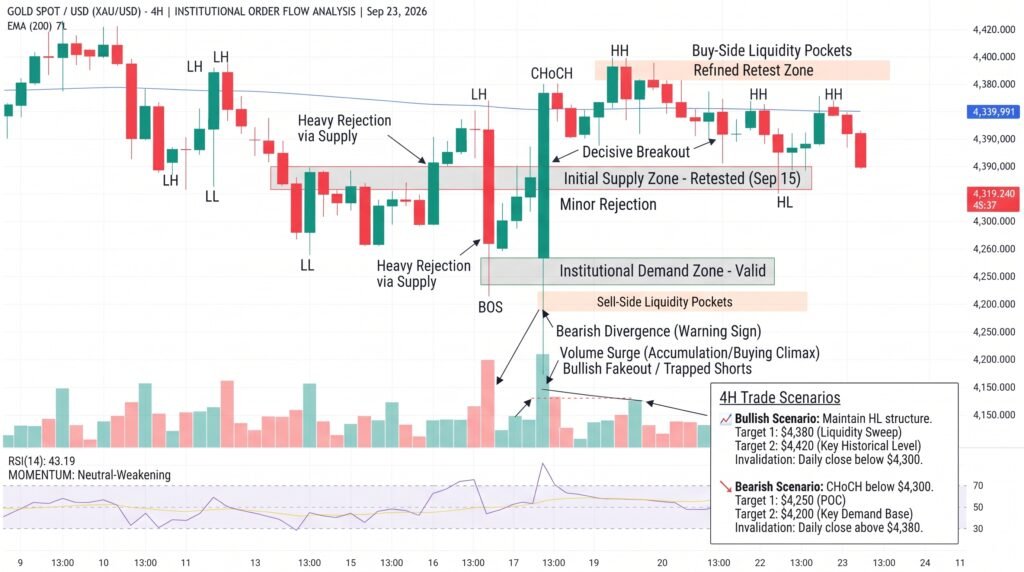
By contrast, a decisive break below $4,355.20 would put the $4,300 structural floor under pressure. If that support fails, the next downside reference is around $4,260, followed by the deeper $4,150 area
The consolidation pattern also resembles a bearish flag, according to the supplied 5-hour setup. Declining volume suggests traders are waiting for a directional break rather than aggressively positioning inside the current range. Gold’s recent market behavior supports that caution: September 22 Comex gold settled at $4,338.90, down 0.16%, while spot prices remained under pressure on September 23.
Conclusion:
Gold’s technical structure remains fragile around the $4,355.20 Fibonacci midpoint, with the broader market trading below key moving averages. A break under this level would shift attention toward $4,300 and $4,260, while a recovery above $4,435 would challenge the current bearish setup. With MACD and SuperTrend still negative and volatility compressed, the next decisive move could determine whether gold extends its correction or begins rebuilding toward higher resistance.
Sources & Methodology
Primary-source standard: Market-moving facts should link to original data releases, regulator notices, company filings or official project announcements whenever available. Secondary reporting is used for additional context, not as a substitute for original evidence.
Page last reviewed: