Silver is consolidating near $66.29 on the 5-hour chart, keeping price above a major long-term support zone while short-term momentum remains uncertain. The latest market data shows spot XAG/USD trading around $66.4 on September 23 after reaching an intraday high near $67.52.
The supplied technical setup places the 200-period Simple Moving Average (SMA) near $65.06, closely aligned with the 38.2% Fibonacci retracement around $64.99. This creates a concentrated support area that could determine whether the current consolidation develops into another advance or a deeper correction.
Silver’s latest weakness is occurring against a firmer U.S. Dollar and a restrictive Federal Reserve backdrop. Higher real yields increase the opportunity cost of holding non-yielding precious metals, while silver also faces sensitivity to expectations for industrial demand.
Technical Momentum Remains Mixed
The broader trend remains supported while silver holds above the 200-period SMA, but shorter-term momentum has weakened. Price has slipped below the 20-period SMA at $66.67, indicating that buyers have lost some immediate control.
The Average Directional Index (ADX) near 17.67 points to a weak trend environment. An ADX reading below 20 is generally associated with limited directional strength, meaning price can remain vulnerable to sharp swings without establishing a sustained trend.
The supplied chart also shows declining volume during consolidation, suggesting reduced participation while traders wait for a clearer directional signal. The latest settled candle was bearish, but there is no major momentum divergence to provide a strong reversal signal.
Key levels remain:
- $65.06: 200-period SMA and primary support
- $64.99: 38.2% Fibonacci retracement
- $63.08: Next major support if $65.06 breaks
- $66.67: 20-period SMA and immediate hurdle
- $68.00: Major range resistance
Silver’s September 23 session has already shown meaningful volatility, with Investing.com recording an intraday range from roughly $66.37 to $67.52.
$68.00 Sets the Next Breakout Test
The $68.00 region remains the clearest upside barrier in the current structure. A sustained break above it would move silver out of the established $65–$68 range and provide stronger evidence that buyers are regaining control.
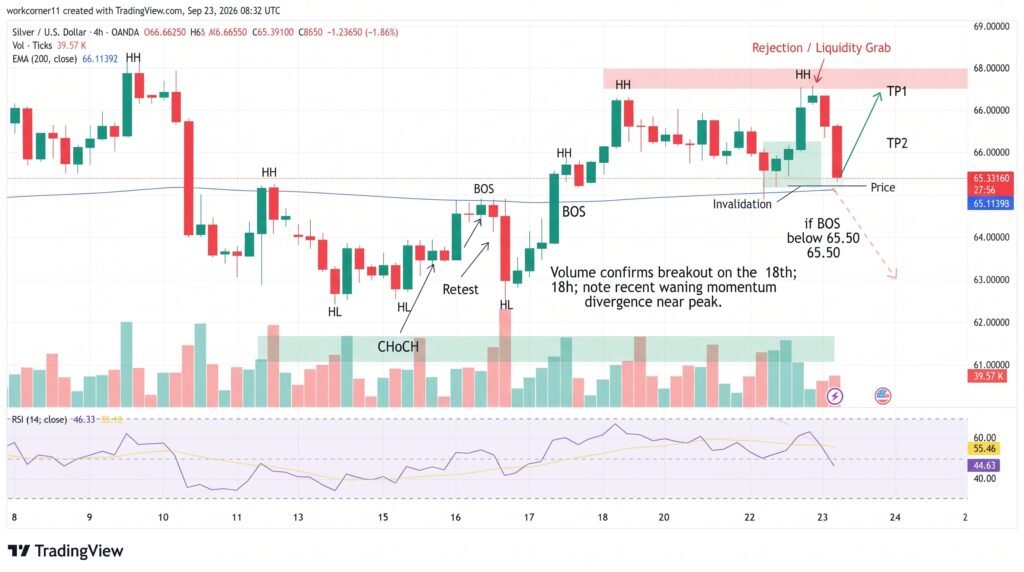
Conversely, a decisive close below $65.06 would weaken the longer-term technical structure and expose the next support near $63.08. Because the 200-period SMA and Fibonacci support are closely aligned, a confirmed break could attract additional technical selling.
The current range also makes the $65.80–$67.00 area less attractive for directional signals. With ADX below 20 and volume declining, price can continue producing short-lived moves before a stronger breakout or breakdown develops.
The broader silver market remains sensitive to monetary policy. Recent market coverage notes that hawkish Federal Reserve expectations, higher real yields and a stronger dollar have pressured silver, although industrial demand remains an important longer-term support for the metal.
Conclusion: Silver Tests $65.06
Silver remains trapped between $65.06 support and $68.00 resistance, leaving the next decisive break as the key technical event. Holding above the 200-period SMA and $64.99 Fibonacci level would preserve the broader bullish structure, while a confirmed break below $65.06 could expose $63.08. On the upside, reclaiming $66.67 would improve short-term momentum, but buyers would need to clear $68.00 to establish a stronger directional move.
Sources & Methodology
Primary-source standard: Market-moving facts should link to original data releases, regulator notices, company filings or official project announcements whenever available. Secondary reporting is used for additional context, not as a substitute for original evidence.
Page last reviewed: