Silver remains under pressure near $64.65 on the five-hour chart, with the metal trading below major trend indicators after a sharp decline. The latest market data shows XAG/USD around the mid-$64 area on Sept. 24, following a 4.16% drop on Sept. 23. The immediate technical focus is whether buyers can reclaim the $65.20–$66.25 area. Until that happens, the $63 region remains an important downside reference.
Silver Momentum Remains Bearish
The five-hour structure continues to favor sellers. Silver is trading below its 200-period moving average, while the broader technical picture also shows price below several medium- and long-term moving averages. Investing.com’s latest technical snapshot places the 200-period simple moving average around $65.42 and classifies the overall reading as “Strong Sell.”
The MACD remains negative, reinforcing the downside momentum. RSI is also below the neutral 50 level, although it is not yet deeply oversold. That distinction matters because a lower RSI alone does not establish that a reversal has started.
- Current reference: around $64.65 in the cited five-hour setup
- 200-period MA: about $65.23 in the chart snapshot
- Immediate resistance: $65.20–$66.25
- Primary support: $63.10–$63.50
$63 Support Becomes the Key Test
The $63.10–$63.50 region is important because it combines prior demand with a Fibonacci retracement reference from the recent advance. Silver has already shown substantial volatility around this area. Historical data shows XAG/USD reached a September low near $62.30 before recovering, while the Sept. 17 session also recorded a low near $62.67.
A sustained break below $63.10 support would put the lower $61 and $58 areas into focus from the supplied chart structure. However, those are technical projection levels rather than confirmed price targets.
The $66.25 resistance area is equally important on the upside. A sustained move above that resistance would weaken the immediate bearish structure and shift attention toward higher resistance levels.
Chart Pattern Signals More Risk
The five-hour chart also resembles a developing head-and-shoulders pattern, with the neckline concentrated around the $63 area. Pattern-based analysis is not confirmation by itself, but a decisive break below support would strengthen the bearish interpretation.
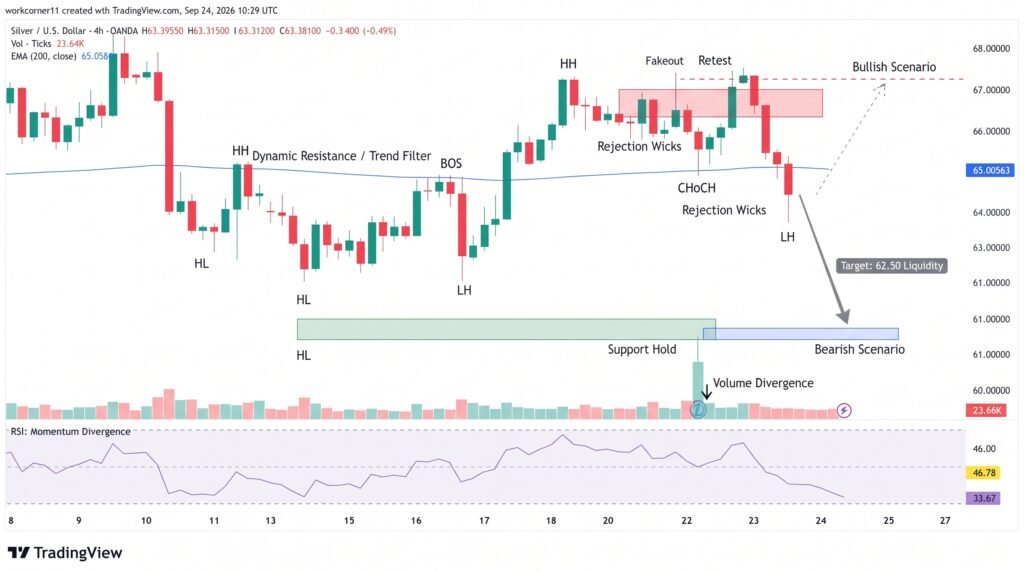
The current $64–$65 zone remains vulnerable to short-term whipsaws because buyers and sellers are contesting a relatively narrow range. ATR is also around $0.31 on the cited timeframe, indicating comparatively contained recent volatility.
Conclusion:
Silver’s near-term structure remains under pressure while XAG/USD trades below key moving averages and resistance. The $63.10–$63.50 area is the critical downside zone, while $65.20–$66.25 represents the first meaningful recovery barrier. A break of either zone would provide a clearer technical signal than price movement inside the current $64–$65 range.
Sources & Methodology
Primary-source standard: Market-moving facts should link to original data releases, regulator notices, company filings or official project announcements whenever available. Secondary reporting is used for additional context, not as a substitute for original evidence.
Page last reviewed: