Natural Gas trades at $2.768 on its 5-hour chart, extending a weeks-long consolidation between $2.616 support and $2.875 resistance. Momentum indicators remain neutral, with the Average Directional Index at just 22.9, reflecting a market without a clear directional edge. A recent doji candle near $2.762 adds to the picture of hesitation, leaving both bulls and bears without a decisive advantage until price breaks from this range.
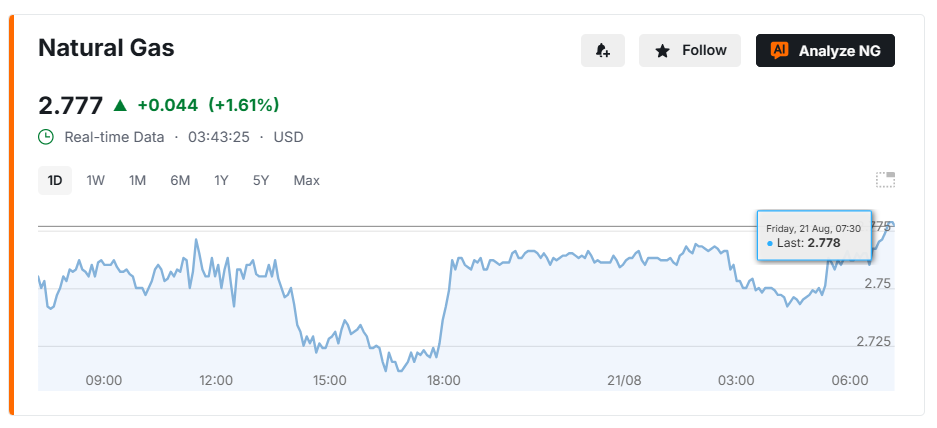
Price Wedged in Tight Range
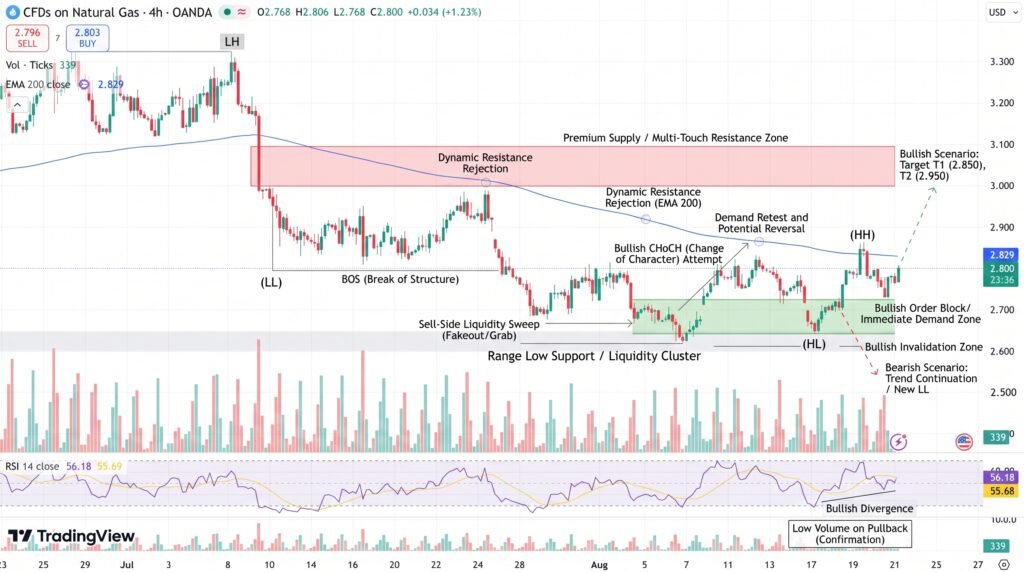
Natural Gas has drifted sideways for weeks inside a band bounded by $2.616 on the downside and $2.875 on the upside. Price currently sits above SuperTrend support at $2.711, giving short-term bulls a technical foothold, but the broader trend remains bearish since price trades below the 200-period moving average at $2.903. MACD momentum reads slightly negative, reinforcing the lack of conviction on either side. Traders eyeing long positions are watching the $2.700 to $2.720 zone, where SuperTrend support aligns with a recent higher low, while short-side traders are focused on the $2.850 to $2.875 range resistance.
Doji Confirms Market Indecision
The formation of a doji candle at $2.762 reinforces the broader pattern of hesitation on this chart. Price sits inside a high-volume node between roughly $2.740 and $2.800, a zone where the Ichimoku cloud and heavy trading volume combine to make sustained moves difficult. The 23.6% Fibonacci retracement level near $2.800 also lines up with the session’s volume peak, adding further resistance to any attempted breakout. High-volume nodes like this one are typically where trending moves stall and where traders chasing breakouts or fades get caught on the wrong side.
- Long bias zone: $2.700 to $2.720, aligned with SuperTrend and a higher-low structure
- Short bias zone: $2.850 to $2.875, the top of the current trading range
- No-trade zone: $2.740 to $2.800, inside the Ichimoku cloud and high-volume node
Key Levels to Watch Next
A volume spike accompanied by a close above $2.800 would offer the clearest bullish confirmation and open the door to scaling into positions above the range. Conversely, a close below $2.711 would hand momentum to macro bears, putting $2.616 back in focus as the next downside target. If price remains trapped between $2.740 and $2.800, traders should expect continued false signals rather than a genuine trend. The Average True Range currently sits at just 1.34%, underscoring how limited actual volatility has been despite the range-bound tension.
Conclusion
Natural Gas’s stall at $2.768 reflects a market genuinely undecided rather than quietly building toward a breakout. With ADX below 25 and price locked between well-defined support and resistance, the setup favors patience over anticipation. A confirmed, volume-backed close beyond either $2.800 or $2.711 offers a far more reliable signal than positioning inside the current high-volume chop.
Sources & Methodology
Primary-source standard: Market-moving facts should link to original data releases, regulator notices, company filings or official project announcements whenever available. Secondary reporting is used for additional context, not as a substitute for original evidence.
Page last reviewed: