
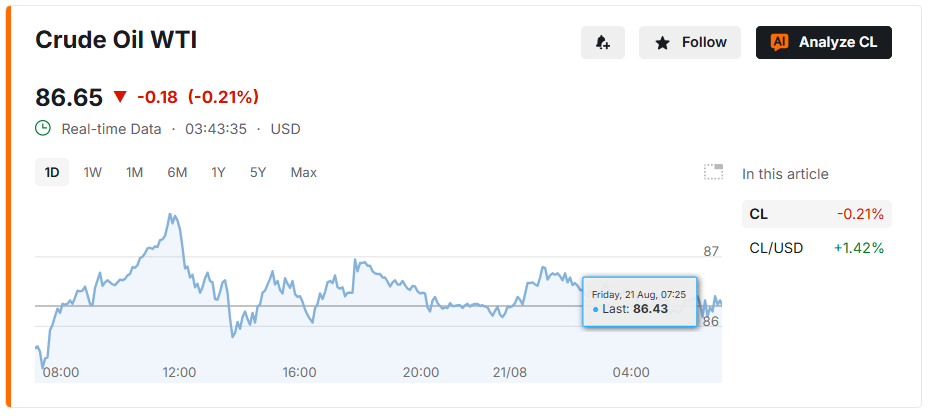
WTI Crude Oil trades at $86.41 on its 5-hour chart, compressed between buyer defense in the mid-$85s and resistance at $87.70. A doji candle has formed at this level, a pattern that reflects indecision rather than direction, with neither buyers nor sellers gaining clear control. The next move from this level could determine whether price extends toward $90.80 or reverses back to $84.50.
Doji Signals Indecision at Resistance
The current 5-hour candle closed at $86.41, forming a doji after price approached but failed to clear $87.70. A doji forms when a session’s open and close land close together despite intraday movement in both directions, and it typically signals that the prevailing trend is losing conviction at that specific level. Given that $87.70 has already capped upside once, its role as resistance carries added weight for traders watching this setup.
Bullish Structure Meets Fading Momentum
Price remains above its 20-period, 50-period, and 200-period simple moving averages, along with the Ichimoku Cloud, all of which point to an intact uptrend on this timeframe. At the same time, the Relative Strength Index reads 64.91, approaching overbought territory, while trading volume has declined as price nears resistance. That combination, rising price with fading volume, often precedes a pause or reversal rather than a clean breakout.
- Price holds above the 20, 50, and 200-period moving averages and the Ichimoku Cloud
- RSI at 64.91 is approaching overbought conditions
- Declining volume near resistance suggests momentum is stalling
Key Levels and No-Trade Zone
A potential double top pattern near $87.70 is roughly 50% complete; a firm rejection at this level could accelerate a move lower, while a confirmed break above $87.80 without follow-through volume risks becoming a false breakout that traps late buyers. The $85.50 to $87.00 range currently carries elevated chop risk, since price is squeezed between the volume-weighted average price and resistance.
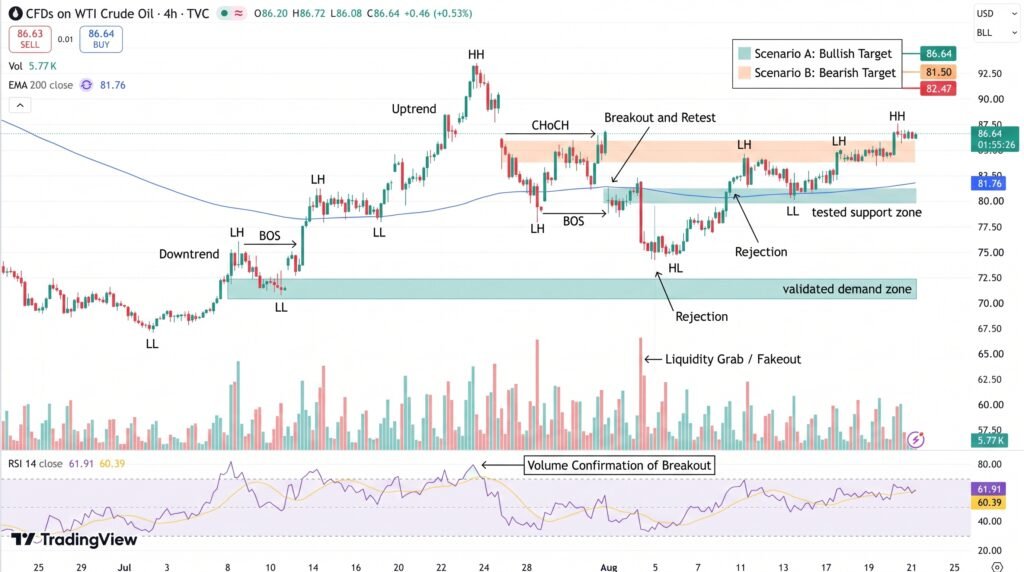
On the support side, $85.72 aligns with a Fibonacci pivot that bulls need to defend, while $82.50 has been tested three times as trendline support; a break below that level would signal a more serious shift in structure. The Average True Range stands at 1.17, or roughly 1.3% of price, indicating that swings from this point could be sharp in either direction.
Conclusion
WTI’s doji at $87.70 marks a genuine decision point rather than a routine pause, with bullish trend structure offset by fading momentum and an incomplete double top pattern. A confirmed break above $87.70 on rising volume would support a move toward $90.80, while a rejection followed by a break below $85.72 would open the path toward $84.50 and, ultimately, the $82.50 trendline support. Waiting for that confirmation, rather than anticipating it, keeps risk aligned with the setup’s actual signal rather than a guess.
Sources & Methodology
Primary-source standard: Market-moving facts should link to original data releases, regulator notices, company filings or official project announcements whenever available. Secondary reporting is used for additional context, not as a substitute for original evidence.
Page last reviewed: