
The New Zealand dollar recovered against the US dollar on Friday, trading near 0.5615 as easing pressure in global bond markets improved investor appetite for risk. The rebound lifted NZD/USD back above 0.5600, but buyers have yet to overcome resistance between 0.5630 and 0.5640. With the pair still close to its 18-month low at 0.5580, the latest advance signals improving short-term momentum rather than a confirmed reversal of the broader downtrend.
Treasury Yields Ease, Lifting Kiwi
Investor sentiment improved after strong demand at a US 30-year Treasury auction helped push long-term yields lower from multi-decade highs. Falling yields can reduce the US dollar’s relative appeal, giving risk-sensitive currencies such as the New Zealand dollar room to recover.
The US Dollar Index (DXY), which tracks the dollar against a basket of six major currencies, pulled back as bond-market pressure eased. However, the Kiwi’s longer-term outlook remains constrained by the difference between monetary policy in New Zealand and the United States.
The Reserve Bank of New Zealand (RBNZ) raised its Official Cash Rate to 2.75% in September. Meanwhile, the Federal Reserve lifted its federal funds target range to 3.75%–4.00% on September 16. The 1.00–1.25 percentage-point gap in policy rates may continue to favor the US dollar, although exchange rates also respond to economic data, future rate expectations and changes in investor sentiment.
NZD/USD Tests Key Resistance
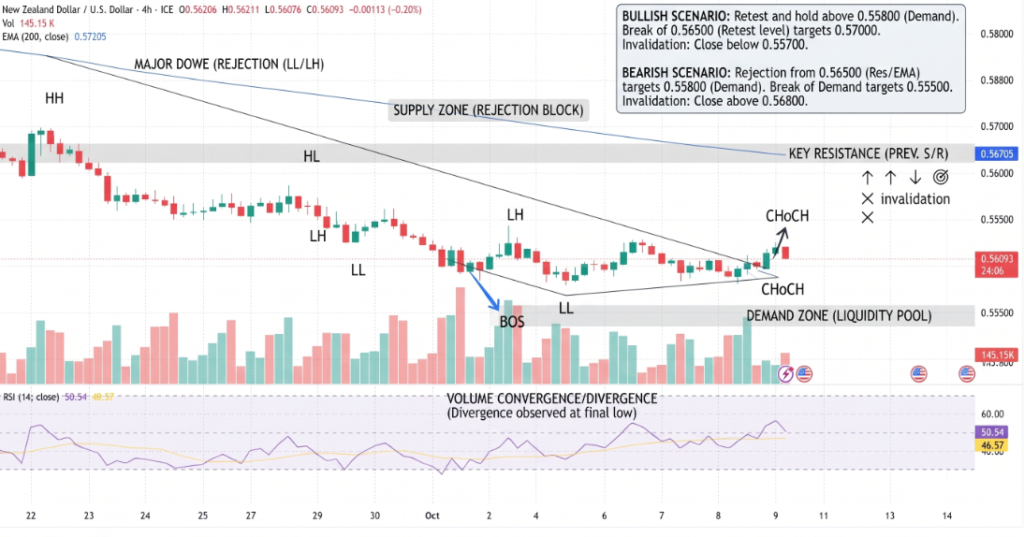
At around 0.5615, technical indicators suggest selling pressure has moderated, but bullish momentum remains unconfirmed. On the four-hour chart, the Relative Strength Index (RSI) is near 54, while the Moving Average Convergence Divergence (MACD) has turned slightly positive. Both readings are consistent with stabilization rather than a decisive change in trend.
A potential double bottom around 0.5580 could provide the basis for a recovery if buyers push the pair above the weekly range ceiling. Traders are watching these technical levels:
- Resistance: 0.5630–0.5640, the immediate breakout zone.
- First upside target: 0.5687, near the September 24 and 28 highs.
- Next resistance: 0.5740, the September 22 high.
- Initial support: 0.5580, around the October 5 and 8 lows.
- Lower support: 0.5530, the 127.2% Fibonacci retracement, followed by the 2025 low at 0.5485.
A sustained move above 0.5640 would strengthen the double-bottom scenario. A break below 0.5580, by contrast, would weaken the recovery case and expose lower support levels.
Policy Divergence Keeps Risks Elevated
The next move will depend on whether improving market sentiment can overcome the interest-rate advantage enjoyed by the US dollar. Bond yields, central-bank guidance and incoming economic indicators could all influence demand for the Kiwi.
The RBNZ’s next scheduled policy update is October 28, according to its published calendar. Until then, traders will assess whether New Zealand’s inflation and growth outlook supports further tightening, while monitoring expectations for the Fed’s next decision.
Conclusion
NZD/USD is showing tentative signs of recovery near 0.5615, supported by easing Treasury yields and firmer risk appetite. However, the 0.5630–0.5640 resistance band remains the key test for bullish momentum. A breakout could open the way toward 0.5687 and 0.5740, while a fall below 0.5580 would revive downside risks toward 0.5530 and potentially 0.5485. The broader outlook remains cautious until price action confirms a sustained reversal.
Sources & Methodology
Primary-source standard: Market-moving facts should link to original data releases, regulator notices, company filings or official project announcements whenever available. Secondary reporting is used for additional context, not as a substitute for original evidence.
Page last reviewed: