
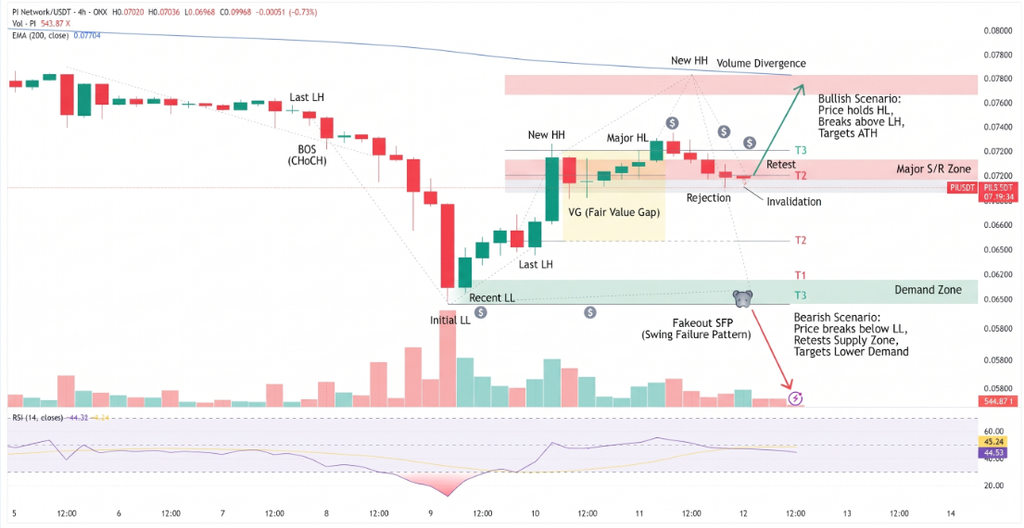
Pi Network (PI) is struggling to extend its recovery, trading near $0.0700 on Thursday after rebounding approximately 8% on Tuesday. The move coincided with the transfer of 593 million PI tokens from an OKX exchange wallet to another wallet, reducing the balance held in the identified exchange address. However, the recovery remains technically fragile. A descending resistance trendline near $0.0730 continues to restrict upward movement, while weak momentum indicators and declining price averages keep the broader outlook tilted to the downside.
OKX Wallet Outflow Raises Supply Questions
A transfer involving 593 million PI tokens from an OKX exchange wallet to a GASW wallet attracted attention on Tuesday. The movement reduced the PI balance in the identified exchange wallet and coincided with the token’s approximately 8% price recovery.
Exchange-wallet outflows can sometimes indicate that investors are moving assets into private wallets or longer-term storage rather than keeping them readily available for exchange trading. A sustained reduction in exchange balances may therefore ease potential immediate selling pressure.
However, a wallet transfer does not necessarily confirm accumulation or establish that the tokens will remain outside exchanges. The destination wallet’s ownership and the holders’ intentions also matter. Consequently, the 593 million PI movement should be viewed as a potentially supportive supply signal rather than definitive evidence of stronger investor demand.
The distinction is important because PI’s recovery has yet to overcome the technical barriers that would indicate a meaningful improvement in market structure.
PI Technical Outlook: $0.0730 in Focus
PI was trading around $0.0702 in the supplied Thursday market snapshot, remaining below the key resistance trendline near $0.0730. The token also trades beneath its 50-day Exponential Moving Average (EMA) at $0.0792 and its 200-day EMA at $0.1097.
Both moving averages point to significant overhead resistance. The 50-day EMA represents the average closing price over roughly ten weeks, while the 200-day EMA provides a longer-term measure of the prevailing trend.
Daily momentum indicators also remain subdued:
- RSI: Around 36, indicating weak momentum and proximity to oversold territory.
- MACD: Below zero, reflecting persistent bearish momentum.
- Immediate resistance: $0.0730, followed by the 50-day EMA at $0.0792.
A sustained move above $0.0730 would provide the first indication that buyers are regaining control. A subsequent break above $0.0792 could strengthen the recovery and bring the higher retracement zone into focus.
Downside Risks and Key Price Levels
If sellers regain control and PI falls below nearby support, attention could shift toward the $0.0516 level. This represents the 127.2% Fibonacci extension, calculated from the referenced price swing, and could become a potential area of interest for buyers.
Further resistance sits at $0.1049, corresponding to the 50% retracement of the decline from $0.1394 to $0.0704. The 200-day EMA at $0.1097 forms another significant hurdle above that level.
Conclusion
Pi Network’s 8% rebound and the 593 million PI exchange-wallet outflow offer some evidence of easing immediate selling pressure, but neither confirms a lasting trend reversal. The $0.0730 trendline remains the immediate breakout barrier, while the 50-day EMA at $0.0792 represents the next major test. Unless PI clears these levels with sustained buying interest, the bearish technical structure remains intact, leaving $0.0516 as a potential downside reference if selling accelerates.
Sources & Methodology
Primary-source standard: Market-moving facts should link to original data releases, regulator notices, company filings or official project announcements whenever available. Secondary reporting is used for additional context, not as a substitute for original evidence.
Page last reviewed: