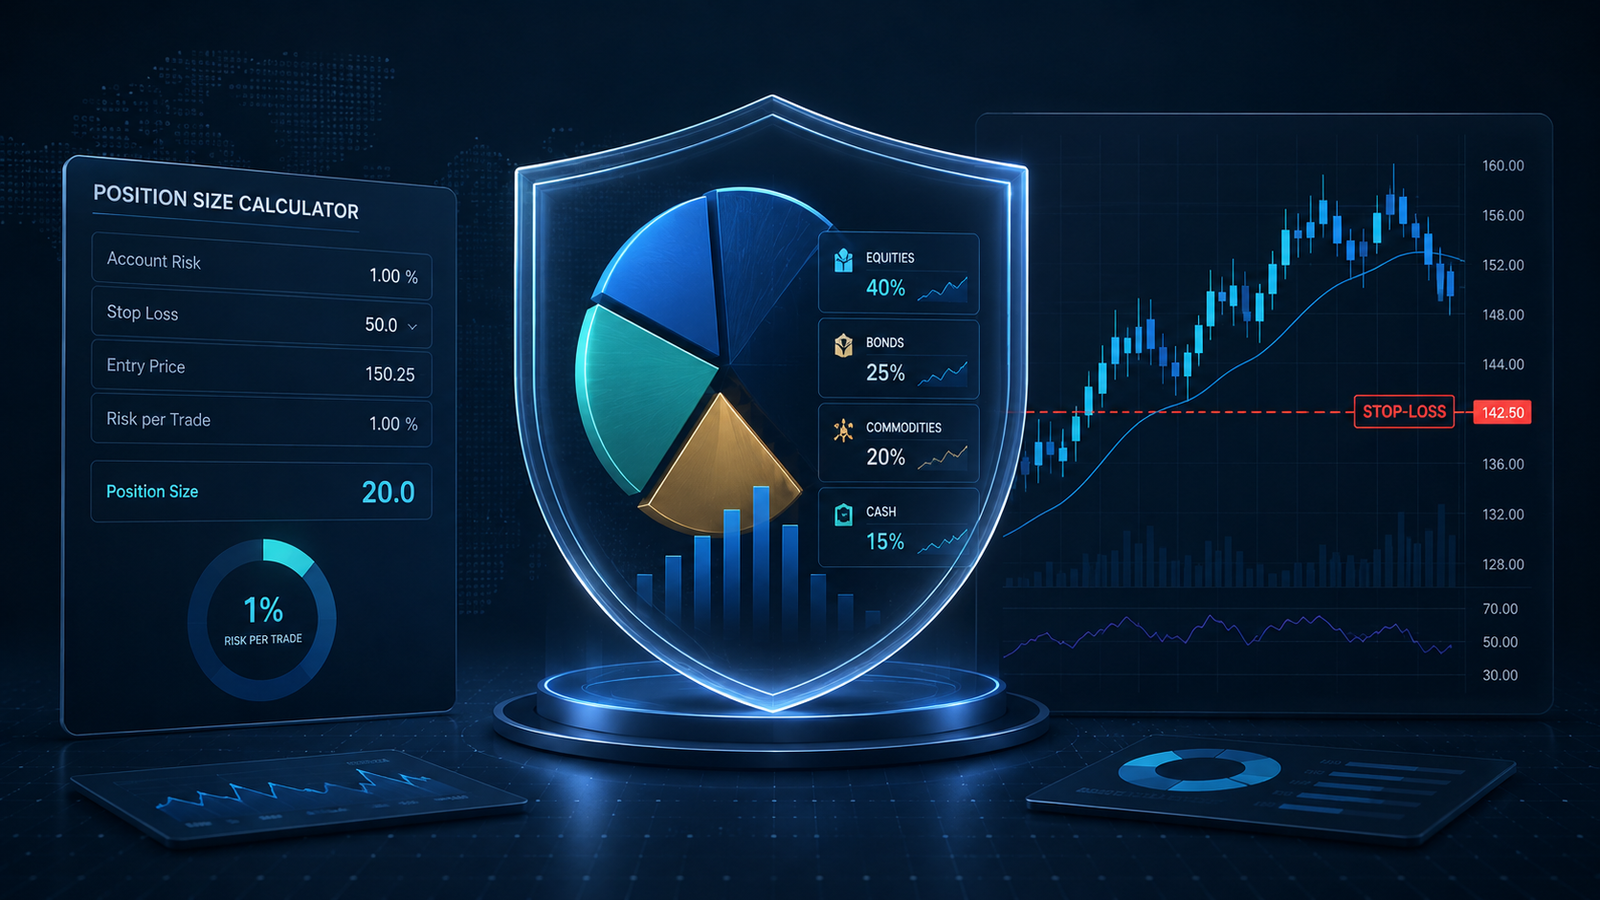
Quick Answer
Risk management in trading is the system that decides how much capital you are prepared to lose if a trade is wrong, how large the position should be, where the trade is invalidated, and how much total exposure your account can carry at one time. Position sizing converts a risk budget into shares, lots or contracts. A sound process starts with the stop level, calculates the loss per unit, then sizes the position so the planned loss fits the account. Risk management cannot turn a losing strategy into a profitable one, and a stop-loss cannot guarantee the exact exit price, but good sizing, exposure limits and drawdown rules can keep one bad trade or one bad period from doing disproportionate damage.
What Is Risk Management in Trading?
Trading risk management is the process of defining what can go wrong before you place the trade. The focus is not only the possibility that price moves against you. A complete risk plan also considers position size, leverage, gaps and slippage, correlated positions, liquidity, event risk and the effect of several losing trades in a row.
That makes risk management different from prediction. Analysis asks, “What do I think the market will do?” Risk management asks, “What happens to my account if I am wrong?” The second question should be answered before the order is sent.
Good risk management requires more nuance than simply choosing a fixed risk percentage and placing a stop. There is no universal risk fraction that suits every strategy, and a stop order can execute away from the requested price in fast markets. The risk policy therefore needs to fit the strategy, volatility, account structure and trader rather than relying on one number for everyone.
The Main Risks a Trader Actually Needs to Manage
| Risk | What it means | Practical control |
|---|---|---|
| Market risk | Price moves against the trade thesis. | Stop/invalidation, position size, diversification. |
| Gap and slippage risk | The market jumps through the intended exit price. | Smaller exposure around event/weekend risk; understand order mechanics. |
| Leverage / margin risk | A large notional position magnifies losses and may trigger forced liquidation or margin calls. | Size from planned loss, not maximum leverage. |
| Liquidity risk | Thin markets can widen spreads and worsen fills. | Trade appropriate instruments/hours; account for spread and slippage. |
| Correlation risk | Several trades respond to the same underlying factor. | Measure combined exposure, not just each position separately. |
| Event risk | Central-bank decisions, earnings or geopolitical shocks change the price distribution suddenly. | Calendar awareness; reduce or avoid exposure when the strategy is not designed for the event. |
| Operational risk | Platform, connection or order-entry mistakes disrupt execution. | Know the platform, verify orders and maintain contingency procedures. |
The Core Risk-Management Sequence
Define the maximum planned loss for the trade in dollars or as a fraction of account equity.
Choose the stop or invalidation level from the market structure, not from the position size you want.
Calculate the risk per share, pip, point or contract.
Calculate the position size that fits the risk budget.
Check whether the target and expected edge justify the risk after spread, commission and slippage.
Check correlated and total account exposure before adding the position.
Know the margin and leverage consequences before execution.
Define what you will do if the account enters a drawdown or if several trades lose in sequence.
After the trade, compare planned risk with actual loss and record the difference.
Position Sizing: The Bridge Between a Stop and Your Account
Position sizing is the calculation that turns an analytical idea into account risk. The same chart setup can be sensible at one size and reckless at another. The basic logic is simple: decide how much you can lose if the setup fails, calculate the loss per unit at the stop, then divide the risk budget by that loss per unit.
Maximum planned loss = Account equity × chosen risk fraction
Position size = Maximum planned loss ÷ Risk per unit
The risk fraction is a policy input, not a universal law. Some educational material illustrates 1%, 2% or similar values, but the right limit depends on the strategy’s losing streaks, volatility, leverage, account structure, time horizon and personal risk capacity. AAFX.IO does not prescribe one percentage for every trader.
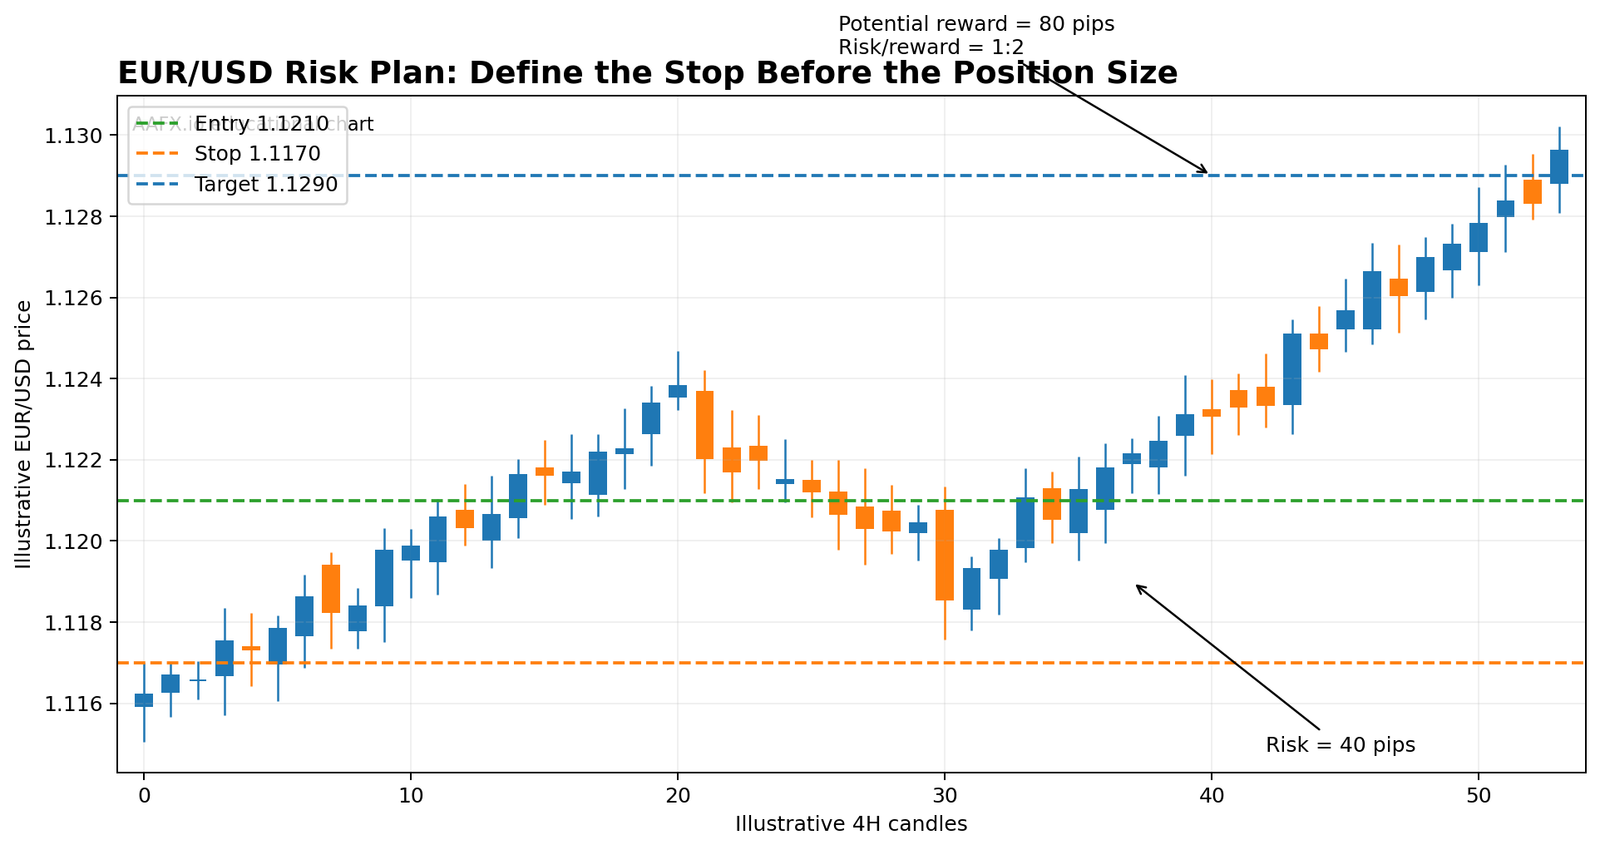
TradingView-style educational example: the technical stop is defined first. Position size is calculated afterward so a 40-pip stop fits the chosen dollar-risk budget.
Forex Position-Sizing Example
Assume a USD-denominated account has $20,000 of equity. The trader chooses a $100 maximum planned loss for this setup. EUR/USD is bought at 1.1210 with an invalidation level at 1.1170, so the stop distance is 40 pips. For EUR/USD, one standard lot is approximately $10 per pip when the account is denominated in USD.
Risk for 1 standard lot = 40 pips × $10 = $400
Position size = $100 ÷ $400 = 0.25 standard lot
The result is 0.25 lot for this simplified example. Pip value changes with pair, contract size and account currency, so a position-size calculator or the broker’s contract specification should be checked before trading crosses, JPY pairs or non-USD accounts.
Stock Position-Sizing Example
Suppose the risk budget is $150, the stock entry is $50 and the technical stop is $47.50. The price risk is $2.50 per share.
Shares = $150 ÷ $2.50 = 60 shares
If the stop were $5 away instead, the position would need to be smaller. The stop determines the share count; the desired share count should not determine the stop.
Futures / CFD Position-Sizing Example
For futures and many CFDs, the risk per contract depends on the instrument’s tick or point value. If the stop is 20 ticks away and each tick is worth $5, one contract has $100 of price risk before slippage and fees. A $250 risk budget would allow two contracts, not three, if the trader wants planned risk to remain at or below the budget.
How Much Should You Risk Per Trade?
This is one of the most searched questions in trading, but the best answer is not “always 1%” or “always 2%.” A percentage only makes sense when it is connected to a strategy’s expected losing streak, account drawdown tolerance and the number of positions that can be open together.
| Risk fraction on a $10,000 account | Planned loss if stop is reached | What changes |
|---|---|---|
| 0.25% | $25 | More runway; smaller position size. |
| 0.50% | $50 | Still conservative relative to the account. |
| 1.00% | $100 | Larger swings; losses compound faster. |
| 2.00% | $200 | Four times the dollar risk of 0.50%; losing streaks become much more costly. |
These are arithmetic examples, not recommendations. The correct amount is the amount that keeps the strategy, combined exposure and drawdown plan inside limits the trader can actually follow.
Stop-Loss Placement: Where Is the Trade Actually Wrong?
A stop-loss should normally sit beyond the point that invalidates the setup. If the trade is based on support holding, the stop belongs where the support thesis has failed, with enough allowance for normal market noise. The stop should not be chosen just because “20 pips feels comfortable.”
Technical stops use structure such as swing highs/lows, support, resistance or pattern invalidation. Volatility-based stops use measures such as ATR to account for how much the instrument normally moves. Both approaches still require position sizing, because a wider logical stop must be paired with a smaller position if the risk budget stays constant.
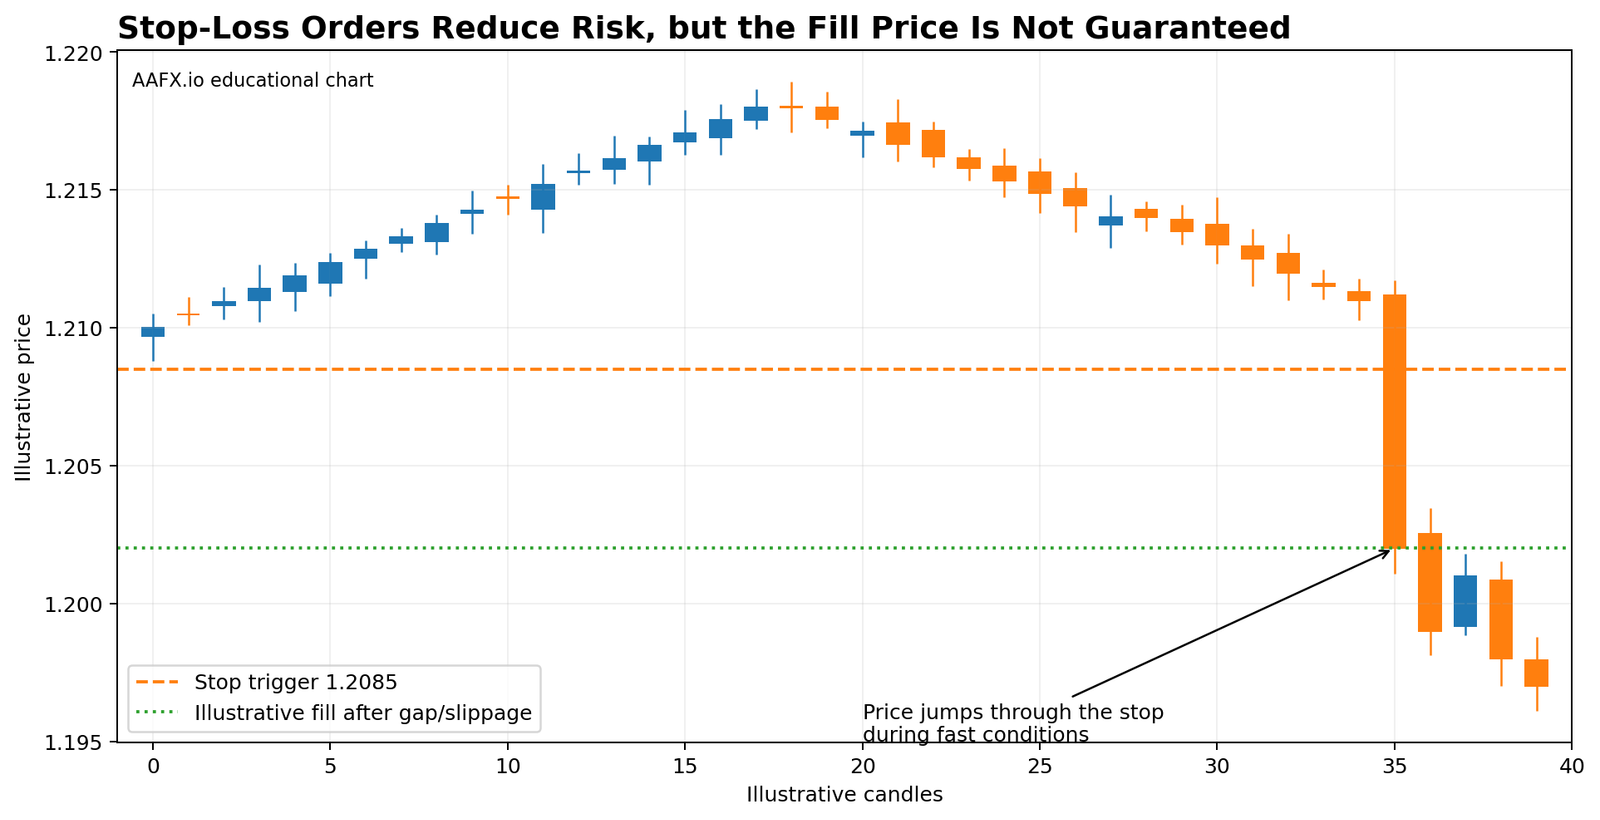
A normal stop order can reduce market risk, but it does not guarantee the exact fill. During gaps or fast markets, execution can occur beyond the trigger price.
Stop Order vs Stop-Limit Order
A standard stop order typically becomes a market order when the trigger is reached, so execution is likely but the price can be worse than expected. A stop-limit order gives more control over the acceptable price, but it can fail to execute if the market moves through the limit. The correct order type depends on the product, broker and strategy. Traders should understand that no order removes market risk completely.
Volatility-Based Position Sizing
Volatility-based sizing keeps the dollar risk stable while allowing the stop distance to adapt to market conditions. When the market is quiet, the stop may be closer and the position can be larger. When volatility expands, the stop may need more room and the position becomes smaller.
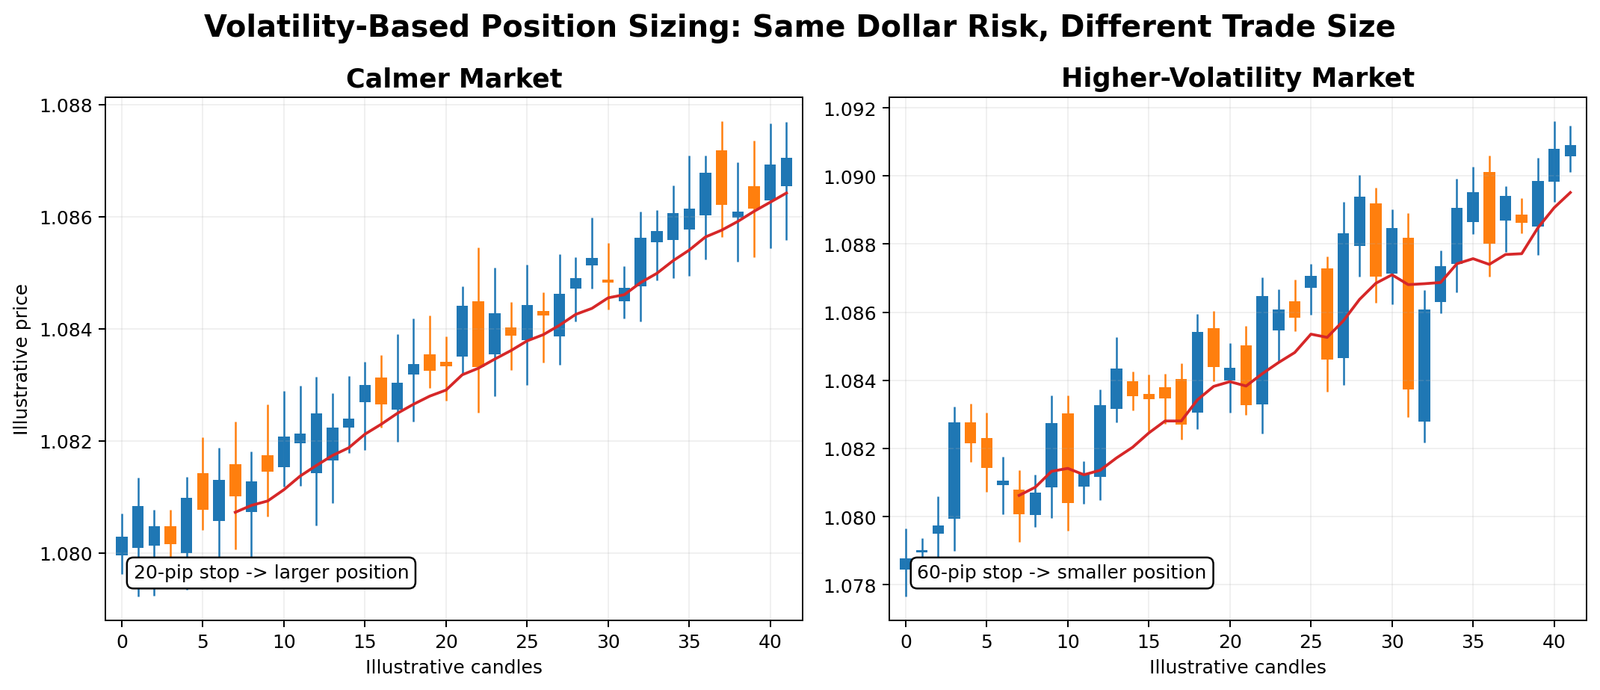
Same risk budget, different position size: a wider volatility-based stop requires a smaller trade if the planned dollar loss is unchanged.
The key benefit is consistency. A trader who uses the same 20-pip stop on every currency pair is treating EUR/USD on a quiet day and an exotic pair during a central-bank shock as if they carry the same movement risk. They do not.
Risk/Reward Ratio Is Useful, but Expectancy Matters More
Risk/reward compares the planned loss with the planned gain. If a trade risks $100 to target $200, the planned reward-to-risk ratio is 2:1, or the risk/reward ratio is 1:2 depending on the convention used. This is useful, but it does not tell you whether the strategy is profitable by itself.
Expectancy = (Win rate × Average win) – (Loss rate × Average loss) – Trading costs
Example: a strategy wins 40% of trades, its average winner is +2R, and its average loser is -1R. Before costs, expectancy is (0.40 × 2R) – (0.60 × 1R) = +0.20R per trade. By contrast, a strategy can have a high win rate but still lose money if the average loss is much larger than the average win. That is why a fixed “minimum 2:1” rule is not universally correct.
Use R-Multiples to Compare Different Trades
One R represents the initial planned risk. If the maximum planned loss is $100, then -1R is a $100 loss and +2R is a $200 gain. R-multiples make it easier to compare a EUR/USD trade, a stock trade and a futures trade without being distracted by different dollar amounts or instrument prices.
Drawdown Management: Protect the Ability to Keep Trading
A drawdown is the decline from an account’s previous peak to a later trough or current equity. Drawdowns are mathematically asymmetric: after losing a percentage of capital, you need a larger percentage gain on the smaller remaining balance to recover.
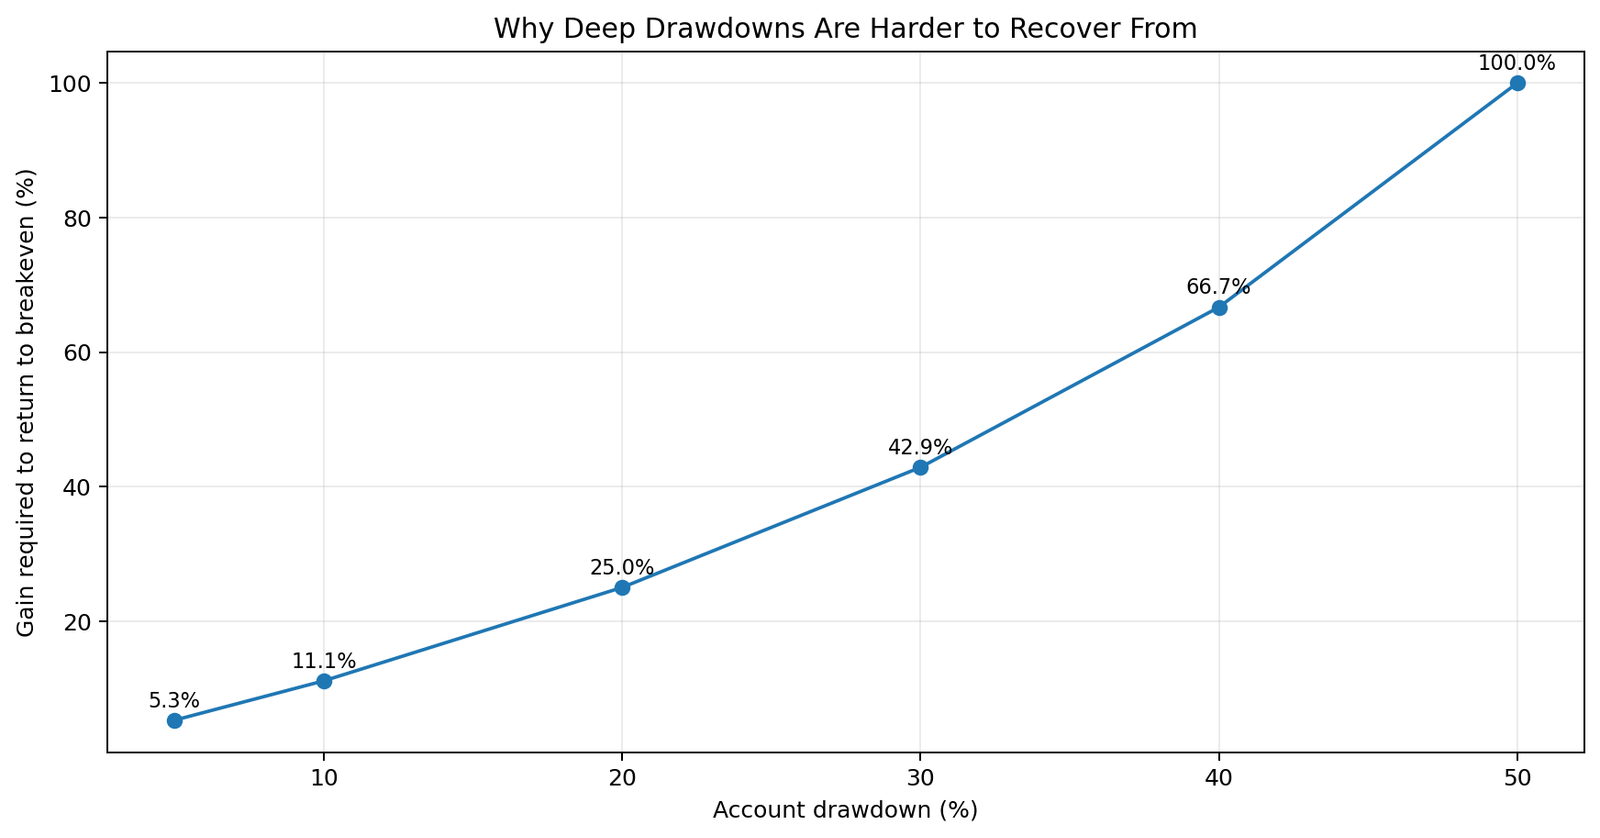
Drawdown recovery becomes increasingly difficult as losses deepen. A 50% drawdown requires a 100% gain on the remaining capital just to return to breakeven.
| Drawdown | Gain required to recover |
|---|---|
| 5% | 5.3% |
| 10% | 11.1% |
| 20% | 25.0% |
| 30% | 42.9% |
| 40% | 66.7% |
| 50% | 100.0% |
This does not mean every trader should use the same drawdown threshold. A drawdown plan should define when normal variance becomes large enough to reduce size, stop trading, review execution or re-test the strategy. The rule should be written before the drawdown, not invented while losses are accumulating.
Daily and Weekly Loss Limits
Short-term traders often use session or weekly loss limits as a behavioral and capital-control tool. The limit can be expressed in R rather than a universal percentage. For example, a trader who risks 0.5% per trade might decide that two full -1R losses in one session trigger a pause and review. Another strategy may need a different threshold because it trades more frequently or has different variance.
The purpose is to stop a normal losing sequence from turning into revenge trading, oversizing or repeated low-quality entries. A daily limit is only useful if it is part of the tested trading plan and is respected.
Correlation and Concentration Risk
Several positions can look diversified while carrying the same underlying risk. A trader who is long EUR/USD and long GBP/USD is short the U.S. dollar in both trades. If the dollar strengthens suddenly, both positions can lose together. The same issue appears with several technology stocks, several oil-sensitive assets or multiple crypto trades during a broad risk-off move.
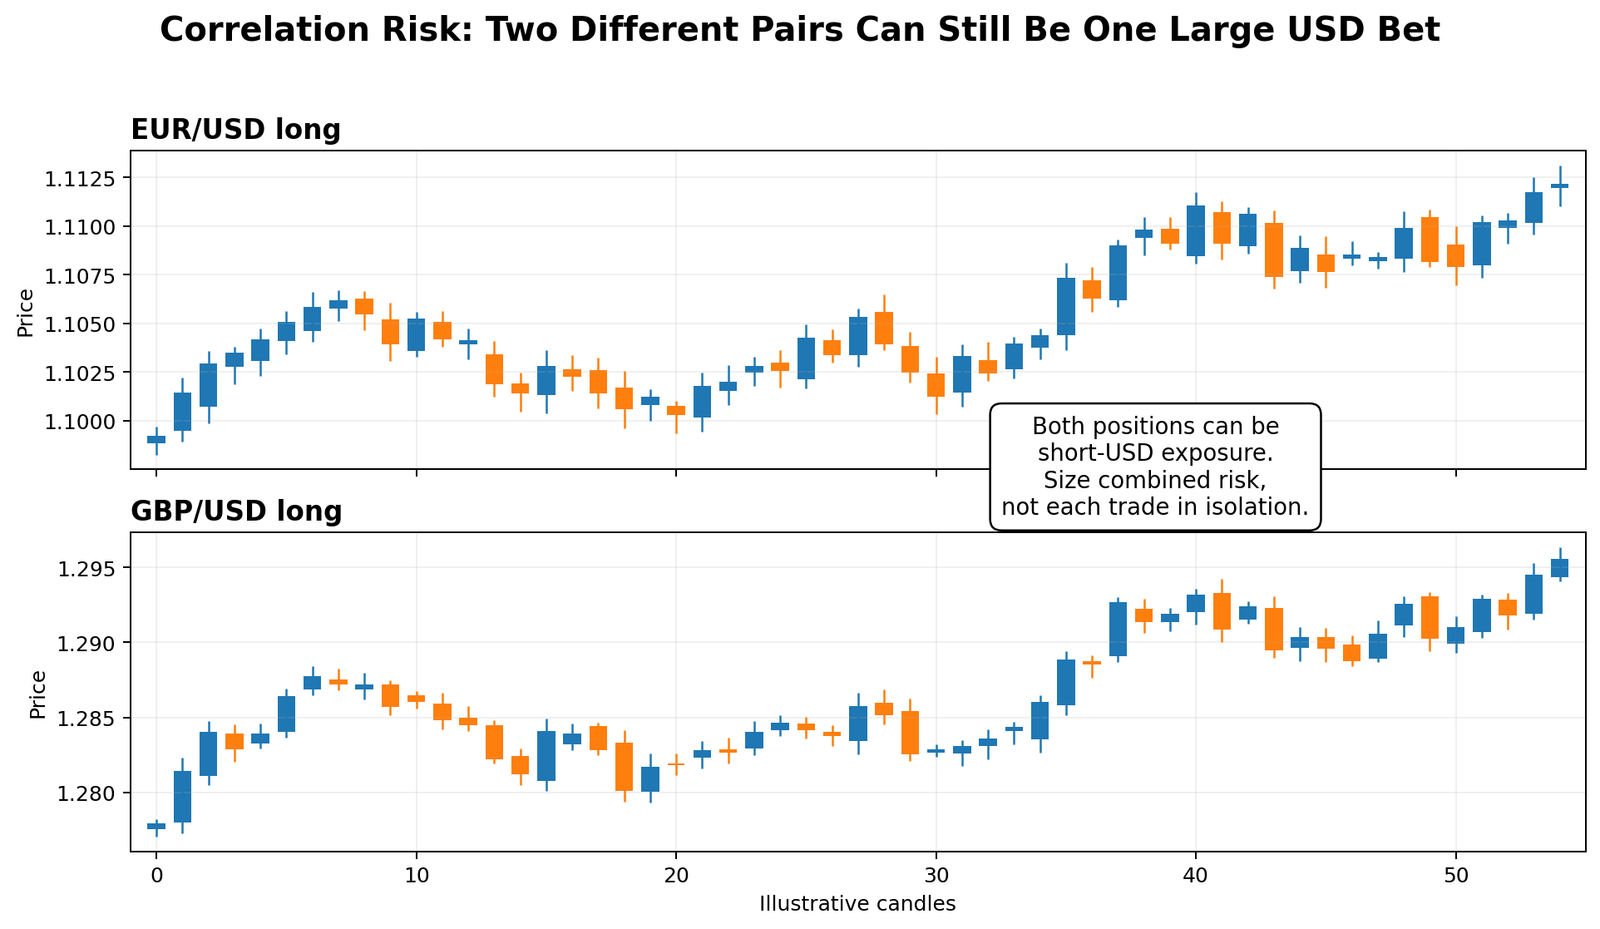
Correlation risk example: EUR/USD and GBP/USD are different pairs, but long positions in both can create concentrated short-USD exposure.
Correlation changes over time, so the answer is not to assume two instruments are always linked. The practical rule is to ask what common factor could hurt several open positions at once and size the portfolio around that combined scenario.
Leverage and Margin: Do Not Confuse Margin With Risk
Margin is the amount required to open or maintain a leveraged position. It is not the same thing as the maximum loss. A highly leveraged trade can require a relatively small margin deposit while exposing the account to a much larger notional position.
This is why position size should come from the risk budget and stop distance, not from the maximum leverage the broker offers. Investor.gov warns that margin can magnify losses and, in some securities accounts, losses can exceed the initial amount invested. Product mechanics vary across stocks, forex, futures and CFDs, so traders should read the relevant margin and liquidation rules.
Four Position-Sizing Methods
| Method | How it works | Main limitation |
|---|---|---|
| Fixed dollar risk | Risk the same dollar amount on each qualifying trade. | Risk does not automatically scale as account equity changes. |
| Fixed fractional | Risk a chosen fraction of current equity and size from the stop. | Losses and gains alter the dollar amount automatically; percentage still must fit strategy variance. |
| Volatility-adjusted | Use ATR or another volatility measure to set stop distance, then size to the risk budget. | Volatility can expand suddenly; ATR is backward-looking. |
| Kelly Criterion | Uses estimated win probability and payoff ratio to estimate a growth-optimal fraction. | Very sensitive to estimation error; full Kelly can be extremely aggressive for real trading. |
Kelly Criterion: Advanced, Not a Beginner Default
Kelly fraction = W – [(1 – W) / R]
W is the estimated win probability and R is the average win divided by the average loss. The formula is mathematically elegant, but real trading inputs are uncertain and change over time. A small error in win rate or payoff assumptions can produce an overly large suggested fraction. That is why some practitioners use fractional Kelly rather than full Kelly, and why beginners should not treat the formula as a licence to increase leverage.
How Risk Management Changes by Trading Style
| Style | Main risk-management focus | Typical mistake |
|---|---|---|
| Scalping / day trading | Spread, slippage, session loss limits, rapid position sizing. | Overtrading after a loss. |
| Swing trading | Overnight gaps, event calendar, correlation across several positions. | Sizing each trade separately while ignoring combined exposure. |
| Position trading | Macro thesis invalidation, financing costs, long drawdowns. | Anchoring to the long-term view after the thesis changes. |
| Event trading | Slippage, spread expansion and abrupt volatility. | Assuming a stop guarantees the planned loss. |
Risk Tolerance vs Risk Capacity
Risk tolerance describes how much uncertainty or loss a person feels comfortable accepting. Risk capacity describes how much loss the account or financial situation can actually absorb without damaging essential goals or obligations. The two can be very different. A trader may feel comfortable with large swings but still lack the capacity to take them. Risk rules should respect the lower of the two constraints.
Useful Risk-Management Tools
Risk tools are useful when they reduce calculation errors or make hidden exposure visible. The goal is not to collect more software; it is to make the process easier to execute consistently.
Position-size calculator: converts account risk, stop distance and contract specifications into a trade size.
Pip / tick-value calculator: helps verify the monetary value of movement for forex, futures and CFDs.
Economic calendar: identifies scheduled events that can change volatility or create gap/slippage risk.
Correlation matrix: helps reveal several positions that may share the same underlying market factor.
Trading journal: records planned risk, actual loss, R-multiple and whether the risk rules were followed.
Broker and exchange contract specifications remain essential because lot size, tick value, margin and liquidation rules vary across instruments and venues.
Use a Trading Journal to Audit Risk, Not Just P/L
A trading journal is different from an economic calendar or news feed. The calendar helps you anticipate event risk; the journal records the trade plan and actual execution so you can compare intended risk with real risk.
Planned dollar risk and R value before entry.
Entry, stop, target and position size.
Actual exit price and realized loss/gain after costs.
Planned risk versus actual loss if the trade failed.
Whether the stop was moved, ignored or slipped.
Combined exposure to the same currency, sector or factor.
Whether the trade followed the written risk rules.
A persistent gap between planned risk and actual losses is one of the clearest signs that the risk system is not being executed as designed. The problem may be slippage, poor sizing, stop movement or trading without a defined exit.
Common Risk-Management Mistakes
Choosing position size before the stop
This reverses the correct process and creates inconsistent dollar risk.
Treating a universal percentage as a law
The same percentage can be conservative for one strategy and too aggressive for another.
Moving the stop farther away after entry
The trade’s risk expands precisely when evidence is moving against the thesis.
Ignoring slippage and spread
A planned -1R loss can become larger in fast or illiquid conditions.
Stacking correlated trades
Several positions may be one concentrated bet in disguise.
Using maximum leverage because it is available
Broker leverage limits are not position-sizing advice.
Focusing only on win rate
High win rate does not compensate for oversized losses or poor expectancy.
Increasing risk to recover a drawdown
This can accelerate the drawdown and increases psychological pressure.
Changing risk after a winning streak
Recent outcomes can create overconfidence even though the next trade remains uncertain.
Pre-Trade Risk Checklist
1. What exact price invalidates the trade thesis?
2. What is the planned loss in dollars and as a fraction of account equity?
3. What share, lot or contract size matches that risk?
4. What is the expected reward and strategy expectancy after costs?
5. How much correlated exposure is already open?
6. What happens if price gaps through the stop?
7. Is major event risk close enough to change normal volatility?
8. Is margin/leverage still acceptable after the new position is added?
9. Does this trade fit the daily/weekly and drawdown plan?
Frequently Asked Questions
What is risk management in trading?
Risk management is the set of rules that controls planned loss, position size, stop placement, leverage, total exposure and drawdown response before and during trading.
What is position sizing?
Position sizing is the calculation of how many shares, units, lots or contracts to trade so that the loss at the stop fits the chosen risk budget.
How do you calculate position size?
Calculate the maximum planned loss, calculate the price risk per unit from entry to stop, then divide the planned loss by risk per unit. For forex, pip value and account currency must also be considered.
What is the 1% rule in trading?
The 1% rule is a commonly cited convention that limits planned loss on one trade to 1% of account equity. It is not a universal requirement; the appropriate fraction depends on strategy variance, leverage, correlation and drawdown tolerance.
How much should a beginner risk per trade?
There is no universal percentage. Beginners usually benefit from using small, consistent risk while learning execution. The amount should be low enough that a losing streak does not force emotional or financial decisions.
Does a stop-loss guarantee my maximum loss?
No. A normal stop can execute at a worse price during gaps or fast markets. A stop-limit controls price better but may not execute at all.
What is a good risk/reward ratio?
No single ratio is always best. Risk/reward must be evaluated together with win rate, average win/loss and costs. Expectancy is more informative than the ratio alone.
What is R in trading?
R is the initial planned risk on a trade. If planned risk is $100, then -1R is a $100 loss and +2R is a $200 gain.
Why is drawdown recovery harder after large losses?
Because the gain is earned on a smaller remaining balance. A 20% drawdown needs a 25% gain to recover; a 50% drawdown requires a 100% gain.
How does leverage affect position sizing?
Leverage determines how much notional exposure can be controlled with margin, but position size should still be set from the planned loss and stop distance. Maximum available leverage is not a recommended trade size.
What is correlation risk in forex?
Correlation risk occurs when several pairs share the same underlying currency exposure. For example, long EUR/USD and long GBP/USD can both lose if the U.S. dollar strengthens.
Is the Kelly Criterion good for trading?
Kelly can be useful as an advanced sizing concept, but it is highly sensitive to estimated win rate and payoff ratios. Full Kelly can produce aggressive exposure when estimates are wrong.
Bottom Line
Risk management starts before the trade. The stop defines where the idea fails; the risk budget defines how much the failure can cost; position sizing connects the two. After that, the trader still needs to account for execution, leverage, correlation and drawdown risk.
The biggest improvement over simplistic risk rules is to stop asking for one universal percentage. Good risk management is strategy-specific and account-specific. The objective is consistency: the same logic should govern position size when the trader is confident, fearful, winning or losing.
AAFX.IO treats risk management as the operating framework around every strategy. A trade idea is not complete until the invalidation level, position size, combined exposure and review process are defined.
Risk warning: Trading, forex, futures and leveraged derivatives involve substantial risk. Position sizing and stop orders can reduce planned exposure but cannot eliminate market, gap, liquidity or execution risk. This article is educational and is not personalised financial advice.
Sources & Methodology
Primary-source standard: Market-moving facts should link to original data releases, regulator notices, company filings or official project announcements whenever available. Secondary reporting is used for additional context, not as a substitute for original evidence.
Page last reviewed: