Quick Answer
The most widely used CFD trading strategies are trend following, breakout trading, range trading, news trading, hedging and pairs trading. Each suits different market conditions and holding periods. Because CFDs are leveraged and charge overnight financing, a good CFD strategy is defined as much by its risk rules and holding period as by its entry signal: fixed risk per trade, a stop-loss set before entry, position size calculated from the stop, and a clear view of how financing costs affect trades held for days or weeks.
Most strategy articles focus on entries. In my experience, entries are the least important part of a CFD strategy. What separates traders who last from those who do not is how they size positions under leverage, where they place stops and how long they hold. A mediocre entry with disciplined risk survives; a brilliant entry with oversized leverage does not.
This guide covers six practical CFD strategies, when each works, and the risk and cost rules that apply to all of them. For more advanced techniques such as scaling and multi-timeframe hedging, see our guide to advanced forex and CFD trading strategies. If CFDs are new to you, start with what CFD trading is.
Before Choosing a Strategy: Three CFD Rules
- Leverage is a ceiling, not a target. Retail leverage in the EU and UK is capped at 30:1 on major currency pairs, 20:1 on major indices and gold, 10:1 on other commodities and 5:1 on individual shares. You do not need to use all of it.
- Size from the stop. Decide the maximum you will lose, often 0.5% to 2% of your account, then calculate position size from the distance to your stop. Our position size calculator does the maths.
- Know your holding cost. Leveraged CFD positions held overnight incur financing. A strategy that holds trades for weeks needs a bigger expected move to cover those costs than one that closes the same day.
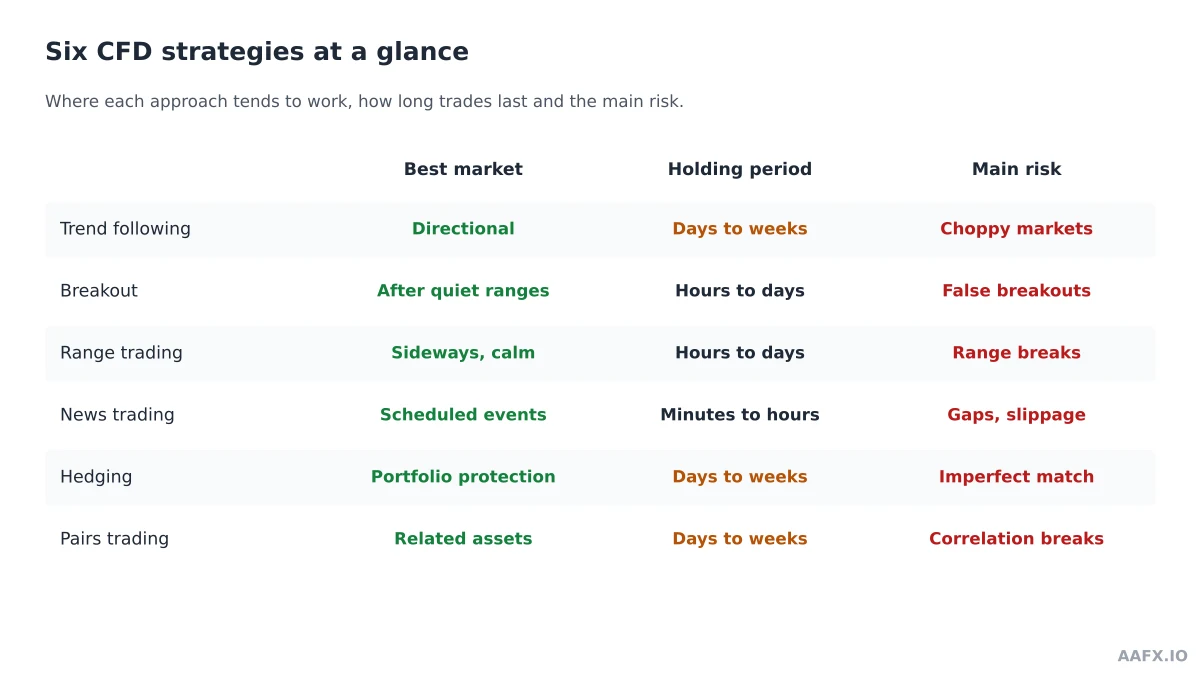
Six CFD Strategies Compared
1. Trend Following
Trend followers aim to trade in the direction of an established move, buying pullbacks in uptrends and selling rallies in downtrends. Common tools include moving averages, higher highs and higher lows, and trendlines. Stops usually sit beyond the most recent swing point.
Works best: in markets with clear direction, such as major indices during sustained rallies or currency pairs driven by widening interest rate gaps. Main risk: choppy, sideways markets that produce repeated small losses. Cost note: trend trades are often held for days or weeks, so financing matters.
2. Breakout Trading
Breakout traders wait for price to move decisively through a well-defined level, such as a range high, a prior day’s high or a chart pattern boundary, and enter on the expectation that momentum will continue. Our guides to support and resistance and flag patterns explain how to identify these levels.
Works best: after periods of low volatility and around session opens. Main risk: false breakouts that reverse quickly. Many traders wait for a candle close beyond the level or a retest before entering.
3. Range Trading
Range traders buy near support and sell near resistance when a market is moving sideways. Oscillators such as the RSI and Bollinger Bands help identify stretched prices within the range.
Works best: in quiet markets without major scheduled news. Main risk: the range breaking, which turns a small expected loss into a larger one if stops are not respected. Stops sit just outside the range boundaries.
4. News Trading
News traders position around scheduled events such as central bank decisions, inflation data or company earnings. Some trade the initial reaction; others wait for the first spike to settle and trade the follow-through. Our guide to how global events move markets covers the releases that matter most.
Works best: on liquid instruments with clear expectations priced in. Main risk: spreads widen and slippage increases sharply around releases, and prices can gap through stops. See our guide to forex trading risks for real examples.
5. Hedging an Existing Portfolio
CFDs make it simple to go short, so investors sometimes use index or share CFDs to protect a portfolio temporarily. For example, an investor holding UK shares who fears a short-term market drop could sell an index CFD rather than selling the shares themselves.
Works best: for short, defined periods around specific risks. Main risk: the hedge and the portfolio may not move in step, and a short CFD on a dividend-paying index or share is usually debited dividend adjustments.
6. Pairs Trading
Pairs traders go long one instrument and short a related one, such as two banks in the same sector or two closely linked indices, aiming to profit from the gap between them rather than from overall market direction.
Works best: when two instruments have a stable historical relationship. Main risk: relationships break down, and running two leveraged positions doubles the costs.
Matching Strategy to Holding Period
| Strategy | Typical holding period | Financing impact | Key indicator or tool |
|---|---|---|---|
| Trend following | Days to weeks | High | Moving averages, swing structure |
| Breakout | Hours to days | Medium | Support and resistance, volume, volatility |
| Range trading | Hours to days | Medium | RSI, Bollinger Bands |
| News trading | Minutes to hours | Low | Economic calendar |
| Hedging | Days to weeks | High | Portfolio exposure analysis |
| Pairs trading | Days to weeks | High, on two positions | Correlation and spread analysis |
A Simple CFD Trade Plan Template
Write these down before every trade:
- Instrument and direction, with the reason in one sentence.
- Entry level or trigger.
- Stop-loss level, placed where the idea is proven wrong.
- Position size calculated from the stop and your fixed risk per trade.
- Target or exit rule, and the minimum reward-to-risk you accept.
- Expected holding period and estimated financing cost.
- Any scheduled events before the expected exit.
Common CFD Strategy Mistakes
- Choosing position size by available margin instead of by risk.
- Holding losing trend trades for weeks while financing quietly adds to the loss.
- Trading every breakout without waiting for confirmation.
- Running several strategies at once on correlated instruments and doubling exposure without noticing.
- Ignoring the broker’s spread and execution quality, which matter most for short-term strategies. See how to choose a broker.
My View: Pick One Strategy and Prove It
My view is that most traders change strategies far too often. Every approach in this guide has losing streaks, and abandoning a strategy after five losses guarantees you never learn whether it works. Pick one strategy that fits your schedule, define the rules in writing, trade it small for at least 50 trades and keep a journal. What would change my assessment of a strategy is that journal: if the average loss is consistently larger than the average win, or costs eat most of the gains, adjust the rules rather than adding more indicators.
Frequently Asked Questions
What is the best CFD trading strategy?
There is no single best strategy. Trend following suits directional markets, range trading suits quiet markets, and breakout and news strategies suit volatile periods. The best strategy is one that fits your schedule and that you can follow consistently with strict risk rules.
How much should I risk per CFD trade?
Many traders risk 0.5% to 2% of their account per trade, calculating position size from the distance to their stop-loss. Because CFDs are leveraged, sizing by risk rather than by available margin is essential.
Are CFDs good for long-term trading?
Leveraged CFD positions incur overnight financing, which adds up over weeks and months. For long holding periods, owning the underlying asset is usually cheaper. CFDs are generally better suited to short and medium-term trades.
Can you hedge with CFDs?
Yes. CFDs make it easy to take short positions, so investors can use index or share CFDs to protect an existing portfolio temporarily. The hedge may not match the portfolio exactly, and costs apply.
What is the difference between CFD and forex strategies?
The principles are the same, since retail forex is often traded as CFDs. The differences are in the instruments: share and index CFDs are affected by earnings, dividends and exchange hours, while currency pairs trade around the clock on weekdays.
Do CFD strategies work in all markets?
No. Each strategy suits certain conditions. Trend strategies struggle in sideways markets, and range strategies struggle when strong trends develop. Identifying the current market condition is part of every strategy.
Risk warning: CFDs are complex instruments and come with a high risk of losing money rapidly due to leverage. You should consider whether you understand how CFDs work and whether you can afford to take the high risk of losing your money. This guide is for educational purposes only and is not investment advice.
Sources & Methodology
Primary-source standard: Market-moving facts should link to original data releases, regulator notices, company filings or official project announcements whenever available. Secondary reporting is used for additional context, not as a substitute for original evidence.
Page last reviewed: