Quick Answer
Support and resistance are price areas where a market has previously paused, reversed or accelerated. Support sits below price and marks an area where buying interest may become strong enough to slow a decline. Resistance sits above price and marks an area where selling interest may slow an advance. They are best treated as zones, not exact pips. Traders use them to identify location, plan entries, place invalidation levels, set targets and judge breakouts or retests. A level is never guaranteed to hold. Trend, timeframe, volatility, news, liquidity and the way price reacts at the zone matter more than the line itself.
What Are Support and Resistance in Forex?
Support and resistance are among the simplest ideas in technical analysis, but they are often taught too rigidly. A support zone is an area where a falling currency pair has previously attracted enough buying or reduced enough selling pressure to slow or reverse the decline. Resistance is the opposite: an area where an advance has previously met enough selling or reduced buying pressure to stall.
These labels describe observed price behaviour, not intrinsic value. EUR/USD is not automatically “undervalued” because it reaches support, and resistance does not mean a pair is fundamentally overvalued. A technical level simply tells us that price has reacted in that area before and may attract attention again.
In my chart work, the first thing that catches my attention is not the exact price of a line. It is the reaction around the area: how quickly price moved away, whether the level is visible on a higher timeframe, whether it aligns with a recent swing, and what would prove the level has failed.
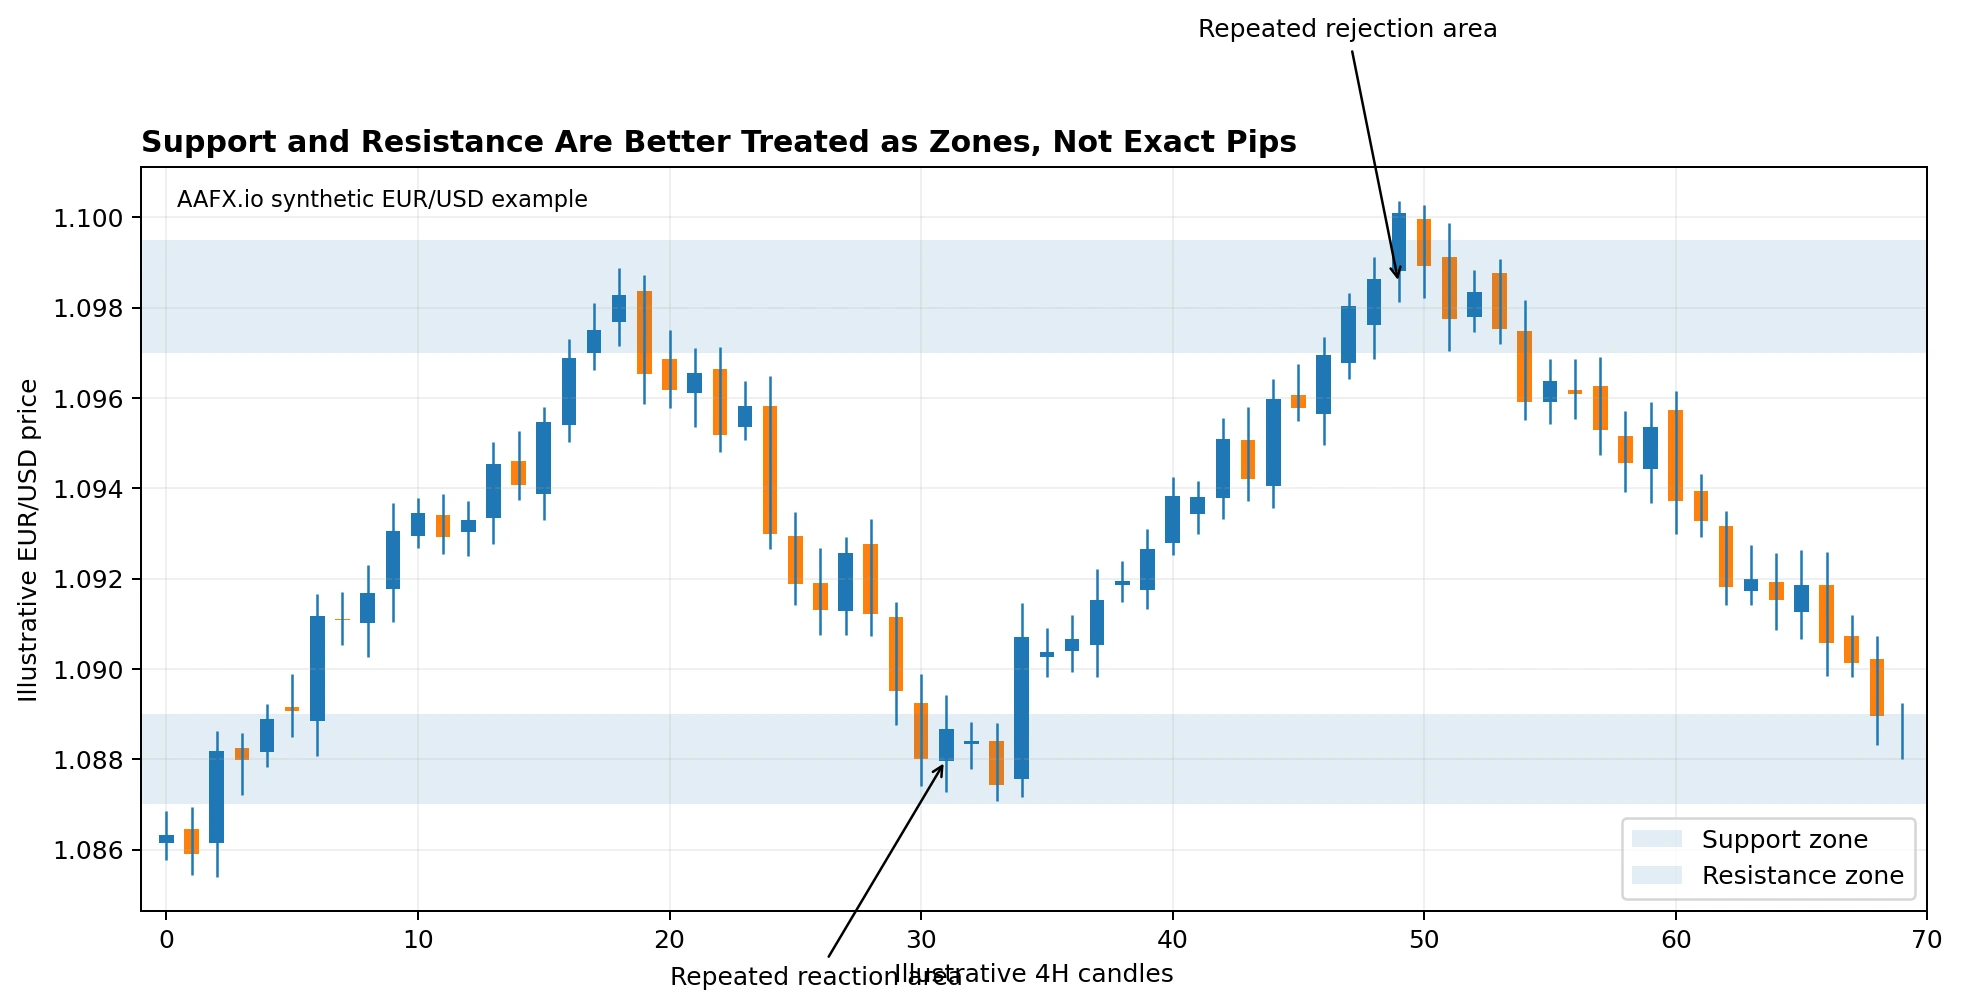
Support and resistance are more realistically treated as reaction zones. Price can trade slightly through a level before reversing, so one exact pip should not be treated as a wall.
Why Support and Resistance Are Zones, Not Exact Lines
Retail charts often show support and resistance as thin horizontal lines because lines are easy to draw. Real price behaviour is messier. Different liquidity providers can quote slightly different highs and lows, spreads change, stop orders cluster around obvious levels, and candles can wick through a previous turning point before closing back inside the range.
BabyPips and several current forex education guides emphasize that support and resistance are usually better thought of as zones. This approach also makes the analysis easier to test: define a zone width using recent candle structure, volatility or a consistent rule, then decide what type of close or follow-through would count as a break.
Why Do Support and Resistance Levels Form?
Previous positioning
Traders who bought or sold near a prior turning point may react when price returns, especially if they want to exit, add or defend a position.
Visible swing highs and lows
Obvious peaks and troughs are widely watched because they provide simple reference points for stops, entries and targets.
Round numbers
Prices such as 1.1000 or 1.2500 are easy to remember and can attract clustered decisions, although round numbers do not work as automatic barriers.
Systematic and institutional reference points
Some strategies use previous highs/lows, pivots, volatility measures or option strikes as reference levels. A chart may therefore react near a level for several reasons at once.
Market memory and attention
A level can become self-reinforcing because more participants notice it. “Memory” is a useful shorthand for repeated behaviour, not proof that the market literally remembers a price.
How to Identify Support and Resistance Levels
The best method is the one you can define and repeat. Start with the clearest price structure before adding indicators.
| Method | What to mark | Main advantage | Main limitation |
|---|---|---|---|
| Swing highs and lows | Recent peaks, troughs and repeated turning areas. | Directly based on price. | Can become subjective if too many minor swings are marked. |
| Range boundaries | The top and bottom of a sideways consolidation. | Clear location for bounce or breakout logic. | Ranges eventually break; boundaries are not permanent. |
| Previous day/week/month highs and lows | Widely watched historical extremes. | Objective and easy to reproduce. | Not every prior high/low is important. |
| Trendlines and channels | Diagonal lines connecting rising lows or falling highs. | Useful in trending markets. | Small changes in anchor points can change the line. |
| Round numbers | Psychological levels such as 1.1000. | Easy to identify. | Too broad to trade without price confirmation. |
| Pivot points | Formula-based levels from prior-session price data. | Objective intraday reference points. | They are calculated levels, not guaranteed reactions. |
| Moving averages | Dynamic averages such as 50- or 200-period MA. | Useful as trend-aligned reference areas. | Lagging and highly dependent on setting/timeframe. |
| Fibonacci retracement | Retracement ratios measured from a chosen swing. | Useful for confluence with price structure. | Swing selection is subjective; ratios alone do not create support. |
1. Recent Swing Highs and Lows
Start with obvious turns. A swing high is an area where an advance stopped and price moved lower. A swing low is an area where a decline stopped and price moved higher. Mark the cluster of highs or lows rather than forcing every candle wick into one precise number. The clearest zones are usually visible without zooming deeply into the chart.
2. Support and Resistance Role Reversal
One of the most useful support-and-resistance ideas is role reversal. When resistance breaks, traders often watch the same area as potential support on a pullback. When support breaks, the old floor can become resistance during a rebound. Fidelity describes this as a core technical-analysis concept, but the word “often” matters: role reversal can fail.
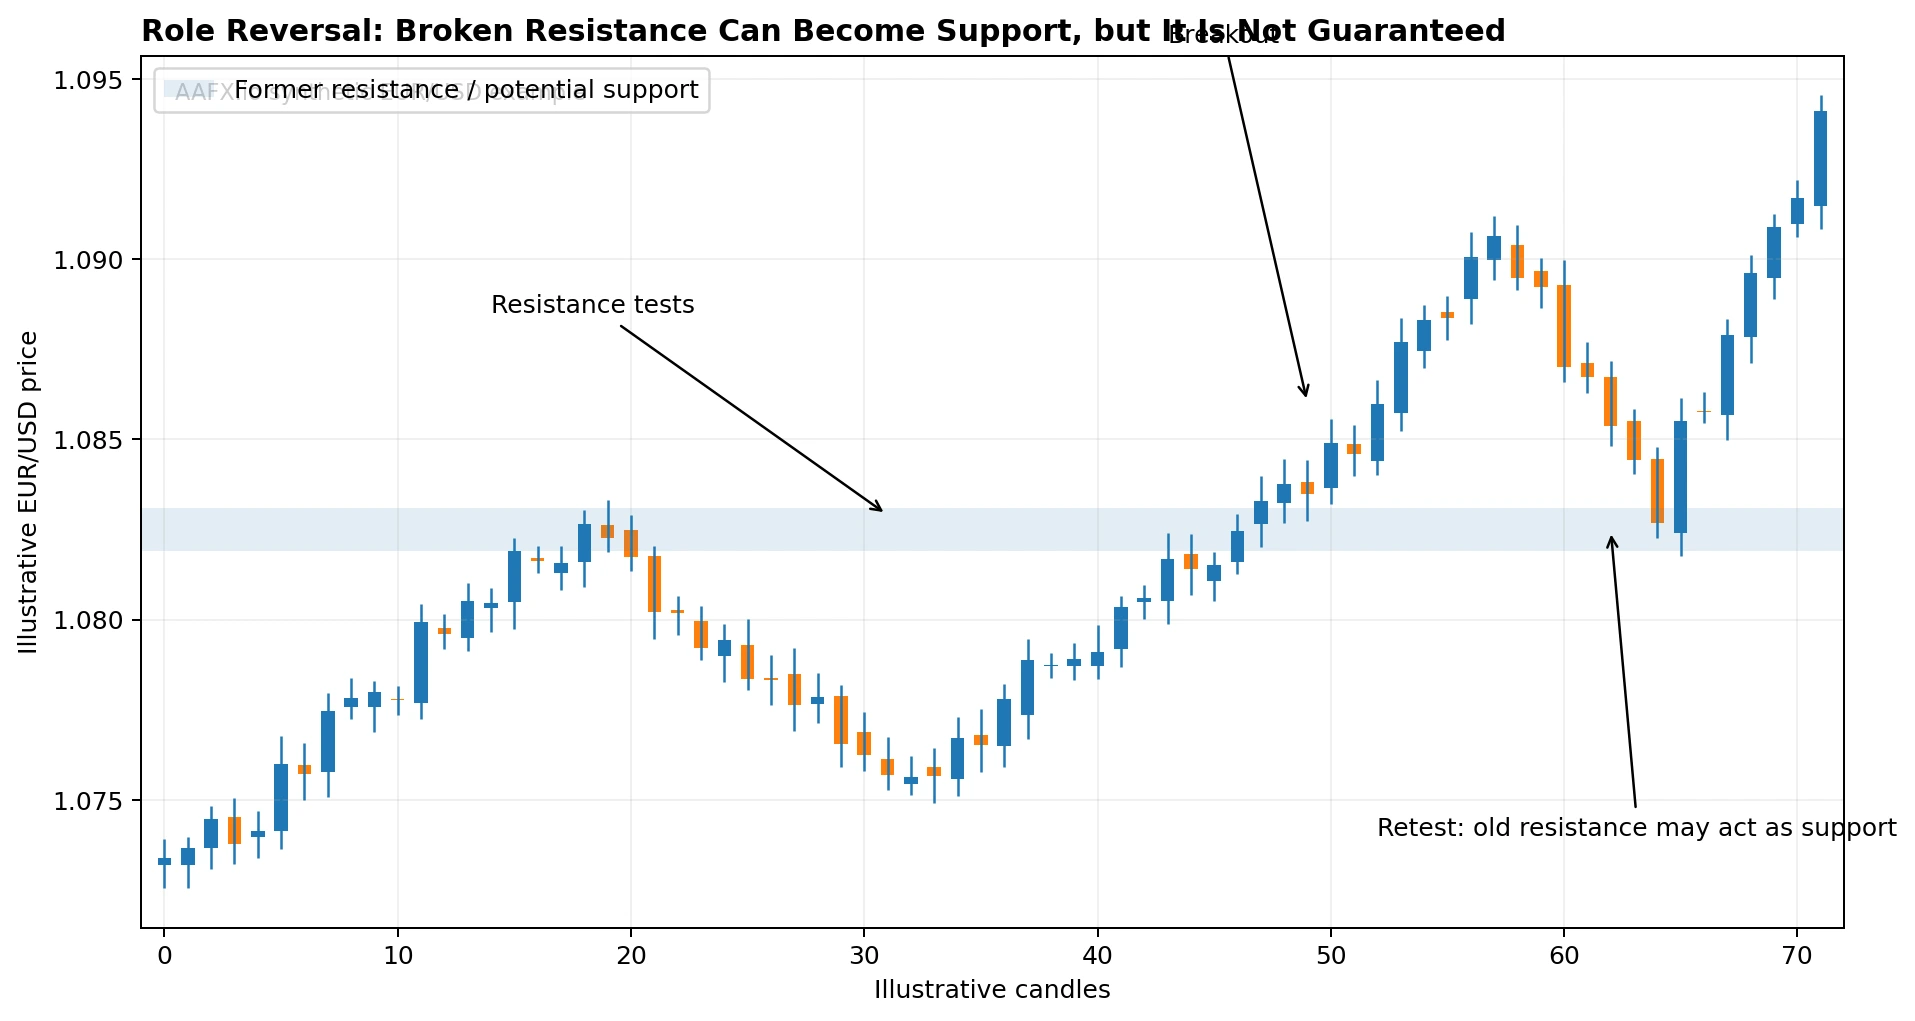
A breakout can turn former resistance into a potential support area during a retest. The retest is evidence to evaluate, not a guarantee that the old level will hold.
3. Trendlines and Channels
Horizontal levels are not the only reference areas. In an uptrend, a line connecting rising swing lows can act as dynamic support. In a downtrend, a line connecting falling swing highs can act as dynamic resistance. A parallel line can create a price channel. The weakness is subjectivity: moving one anchor point can change the slope, so the rule for choosing touches should be consistent.
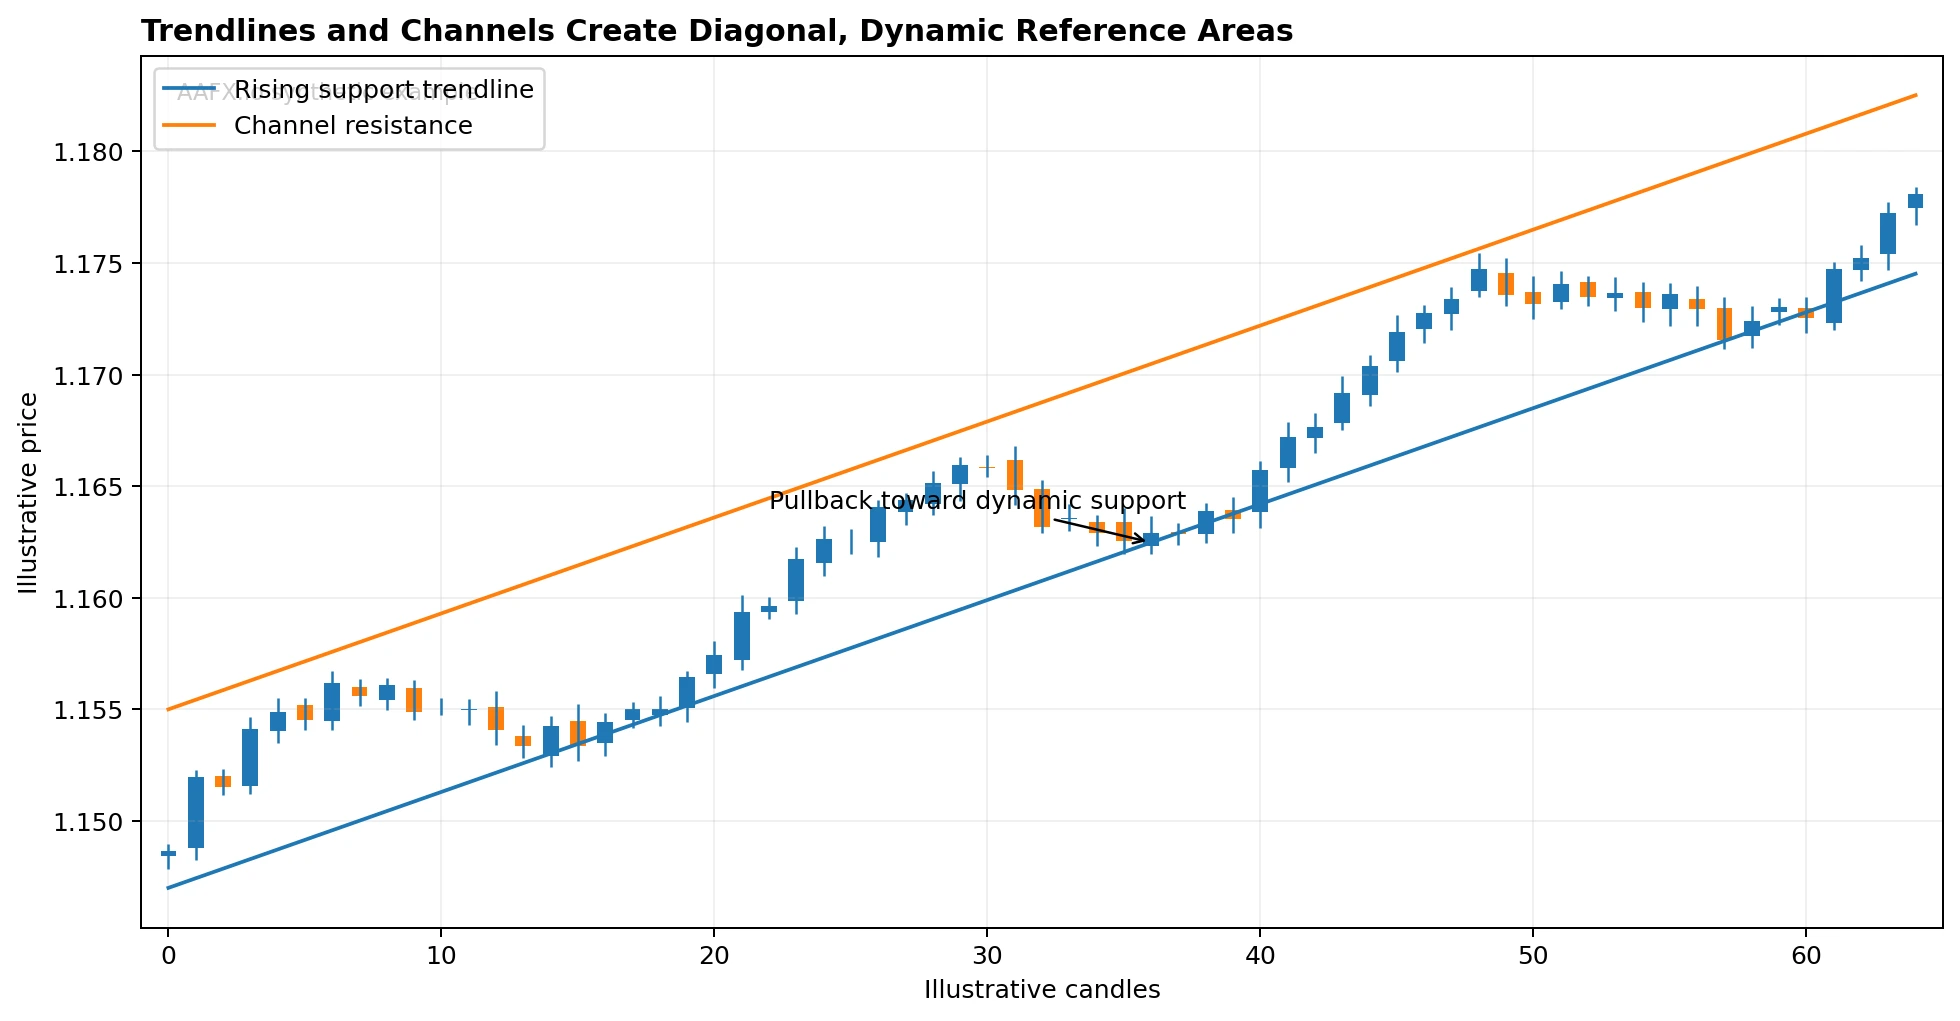
Trendlines and channels create diagonal support and resistance references. Treat them as areas of interaction rather than exact rails that price must follow.
4. Round Numbers, Pivot Points and Fibonacci
Round numbers such as 1.1000 can attract attention because traders naturally cluster decisions around memorable prices. Pivot points are more mechanical: the classic pivot uses the previous period’s high, low and close, then derives support and resistance levels around that pivot. Pivot levels can be used as support and resistance references, but signals should still be confirmed with other analysis.
Fibonacci retracement is another secondary tool. Commonly watched ratios include 38.2%, 50% and 61.8%, although 50% is a convention rather than a Fibonacci ratio. The useful question is not whether a Fibonacci number is “magic.” It is whether a retracement area overlaps a clear price swing, round number or other independently defined zone.
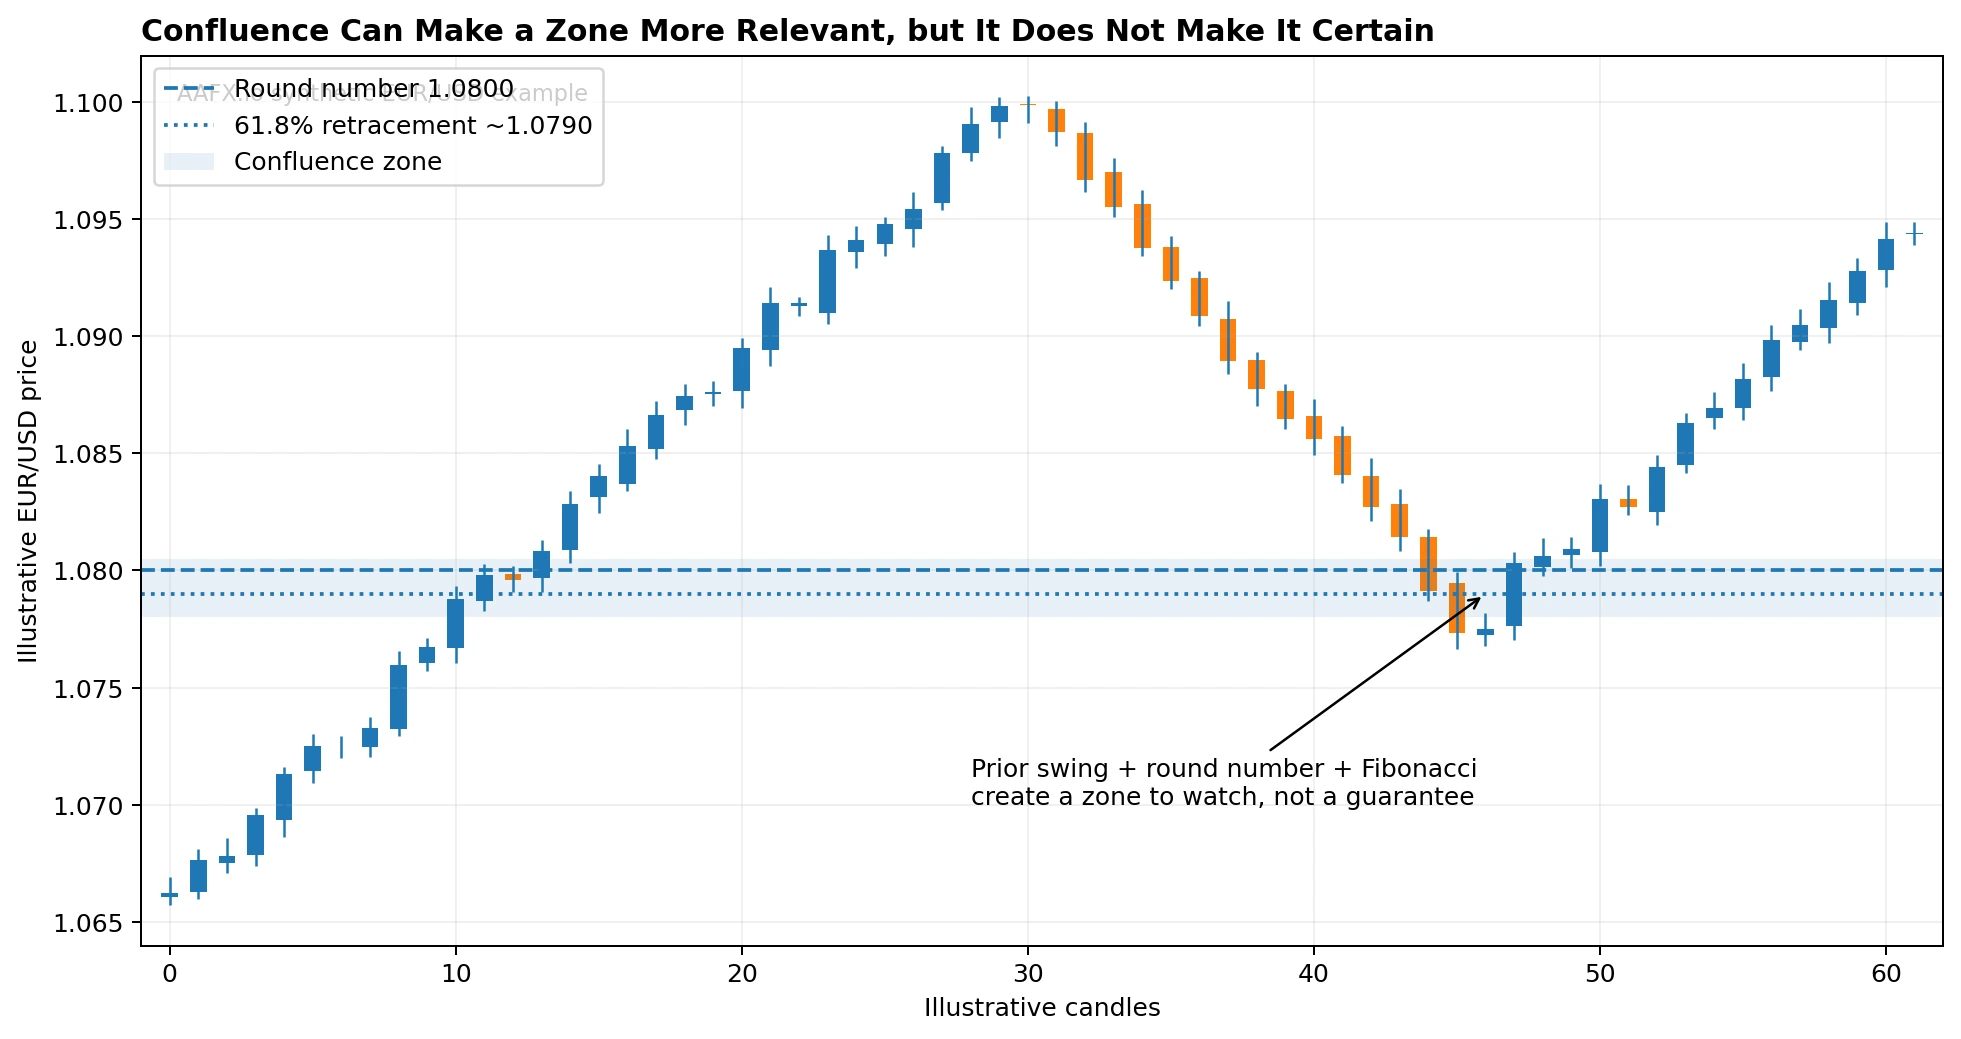
Confluence can make a zone easier to justify because several independent references overlap. It does not turn the area into a certainty.
How Do You Judge the Quality of a Support or Resistance Zone?
| Factor | What to look for | Important caveat |
|---|---|---|
| Clarity | Obvious swing or range boundary visible without forcing the chart. | A level can be clear and still fail. |
| Timeframe | A level visible on a higher timeframe may be watched by more participants. | Higher timeframe does not mean guaranteed. |
| Recency | Recent reactions often matter because positioning and market context are fresher. | Old major levels can still matter. |
| Reaction strength | A sharp move away shows that the balance changed decisively at that time. | Historical reaction does not prove future reaction. |
| Number of reactions | Repeated reactions can make a zone more visible. | Repeated tests can also consume available interest; more touches do not automatically mean stronger forever. |
| Confluence | Two or more independent methods identify a similar area. | Do not count several correlated indicators as independent evidence. |
| Room to target | There is enough distance to the next opposing level for the strategy’s risk/reward logic. | A wide target is meaningless if the entry/invalidation rule is poor. |
A common teaching rule says that the more often a level is tested, the stronger it becomes. That is only partly useful. Repeated reactions can make a level more visible, but repeated tests can also reduce the amount of resting interest around the zone. Rather than assuming strength rises with every touch, record the rule and test how your market behaves.
Multi-Timeframe Support and Resistance
A level can look important on one timeframe and irrelevant on another. A daily chart may show a broad support zone while a 15-minute chart shows nearby intraday resistance. Neither chart is automatically “right.” Each answers a different question.
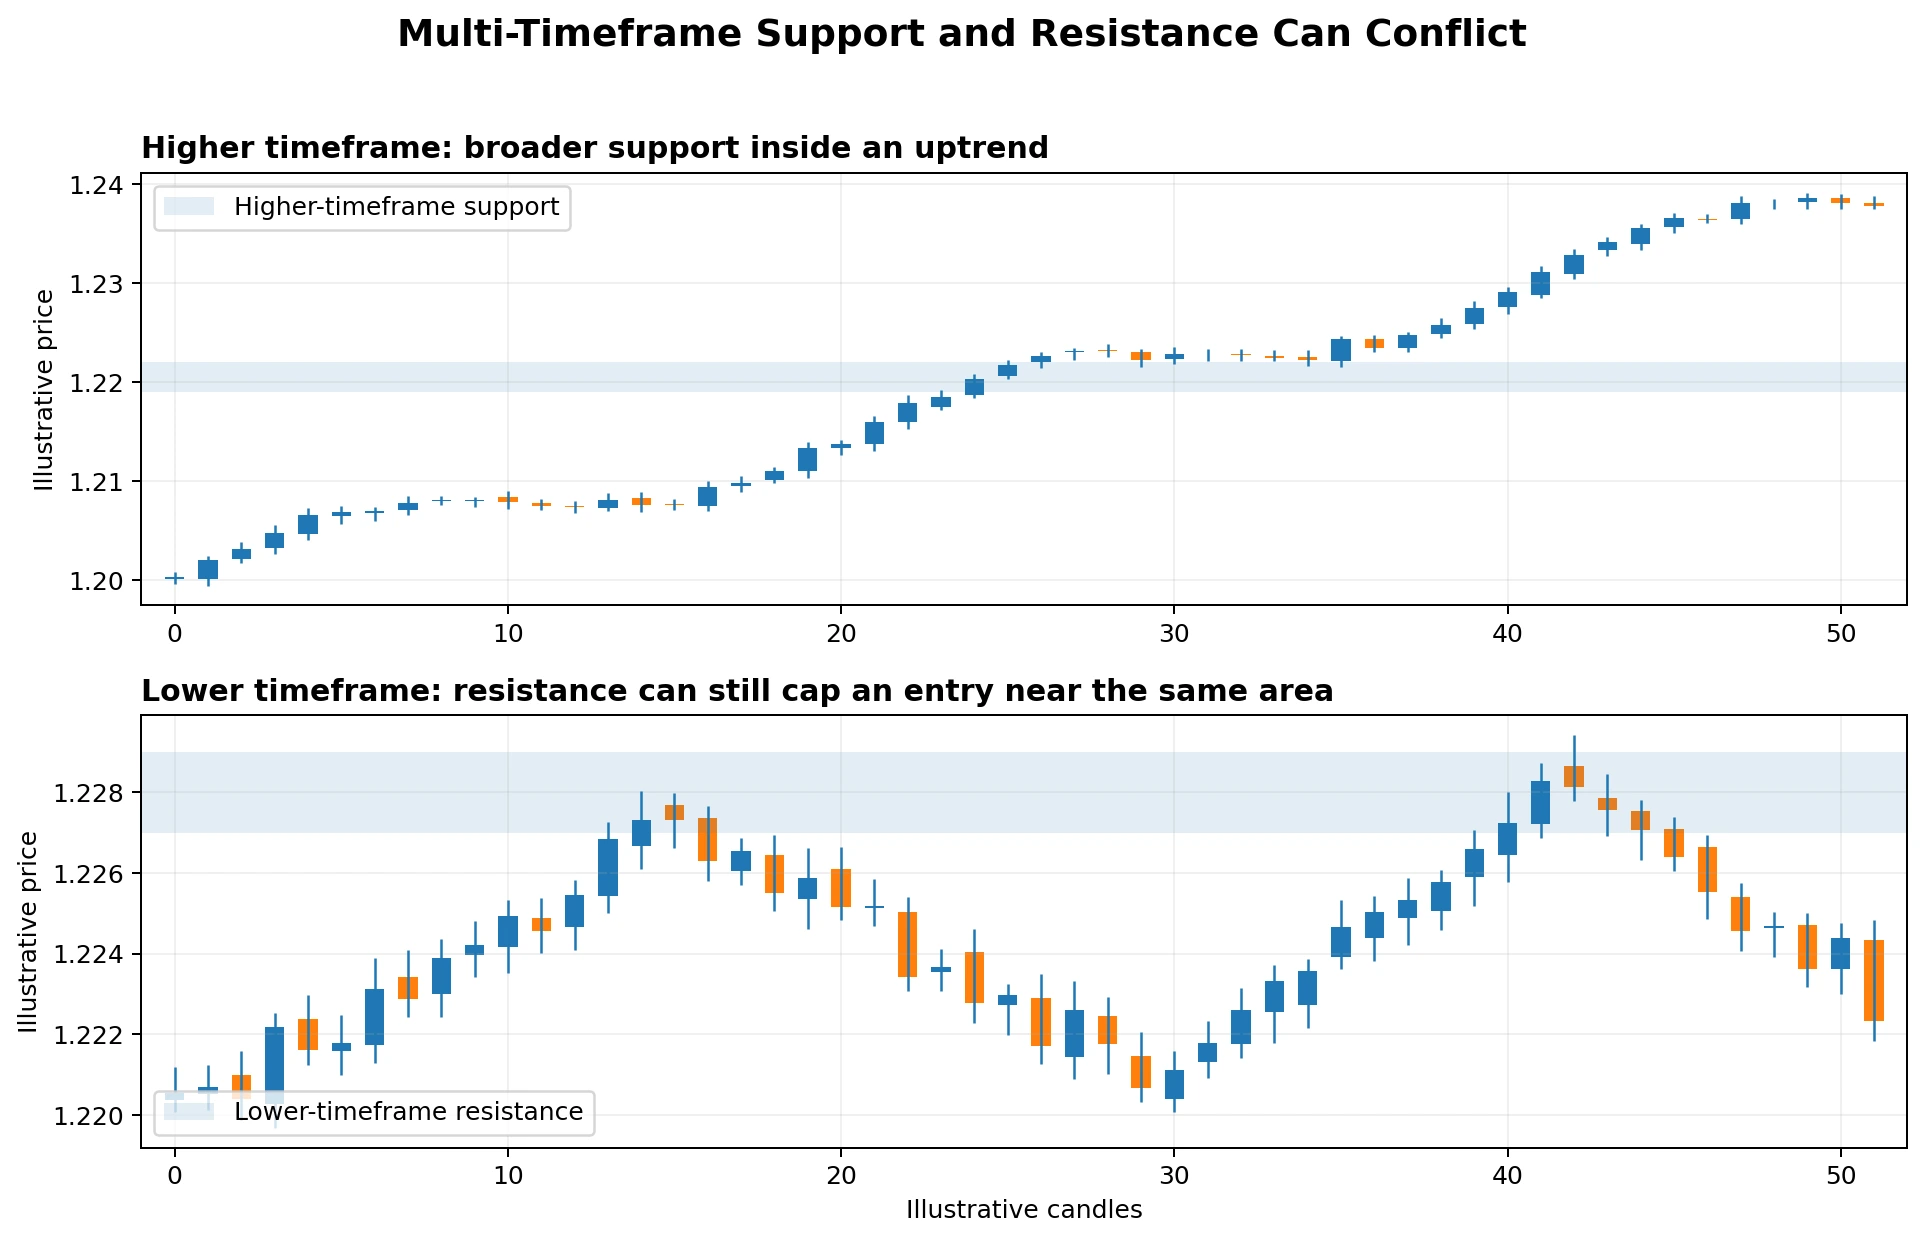
Higher- and lower-timeframe levels can conflict. Give each timeframe a fixed role so the analysis does not change after the trade starts.
A simple workflow is to use a higher timeframe to define the major zone, then a lower timeframe to look for entry structure. For example, a swing trader might identify daily support, then use the 4-hour chart for a rejection candle or break-and-retest setup. The important part is to define the timeframe hierarchy before entering.
How to Trade a Support or Resistance Bounce
A bounce strategy assumes the zone will hold and price will rotate away from it. Waiting for confirmation helps define a bounce setup before placing an order at a level. The confirmation should be defined, not improvised.
- Mark the zone before price reaches it.
- Check whether the broader trend and nearby event risk support the setup.
- Wait for a defined reaction such as a rejection candle, a failed break, or a close back inside the zone.
- Place the invalidation beyond the area that proves the bounce thesis wrong.
- Calculate position size from the stop distance and risk budget.
- Identify the next opposing support/resistance area before setting a target.
A support bounce is not “safe” because buyers appeared there before. The trade becomes a structured risk decision only after the invalidation level and position size are defined.
How to Trade a Breakout and Retest
A breakout strategy assumes the level will fail and price will establish value beyond it. The word “breakout” needs a rule. Some traders require a candle close beyond the zone. Others require follow-through, a volatility filter or a retest. A wick through the line is not automatically a confirmed breakout.
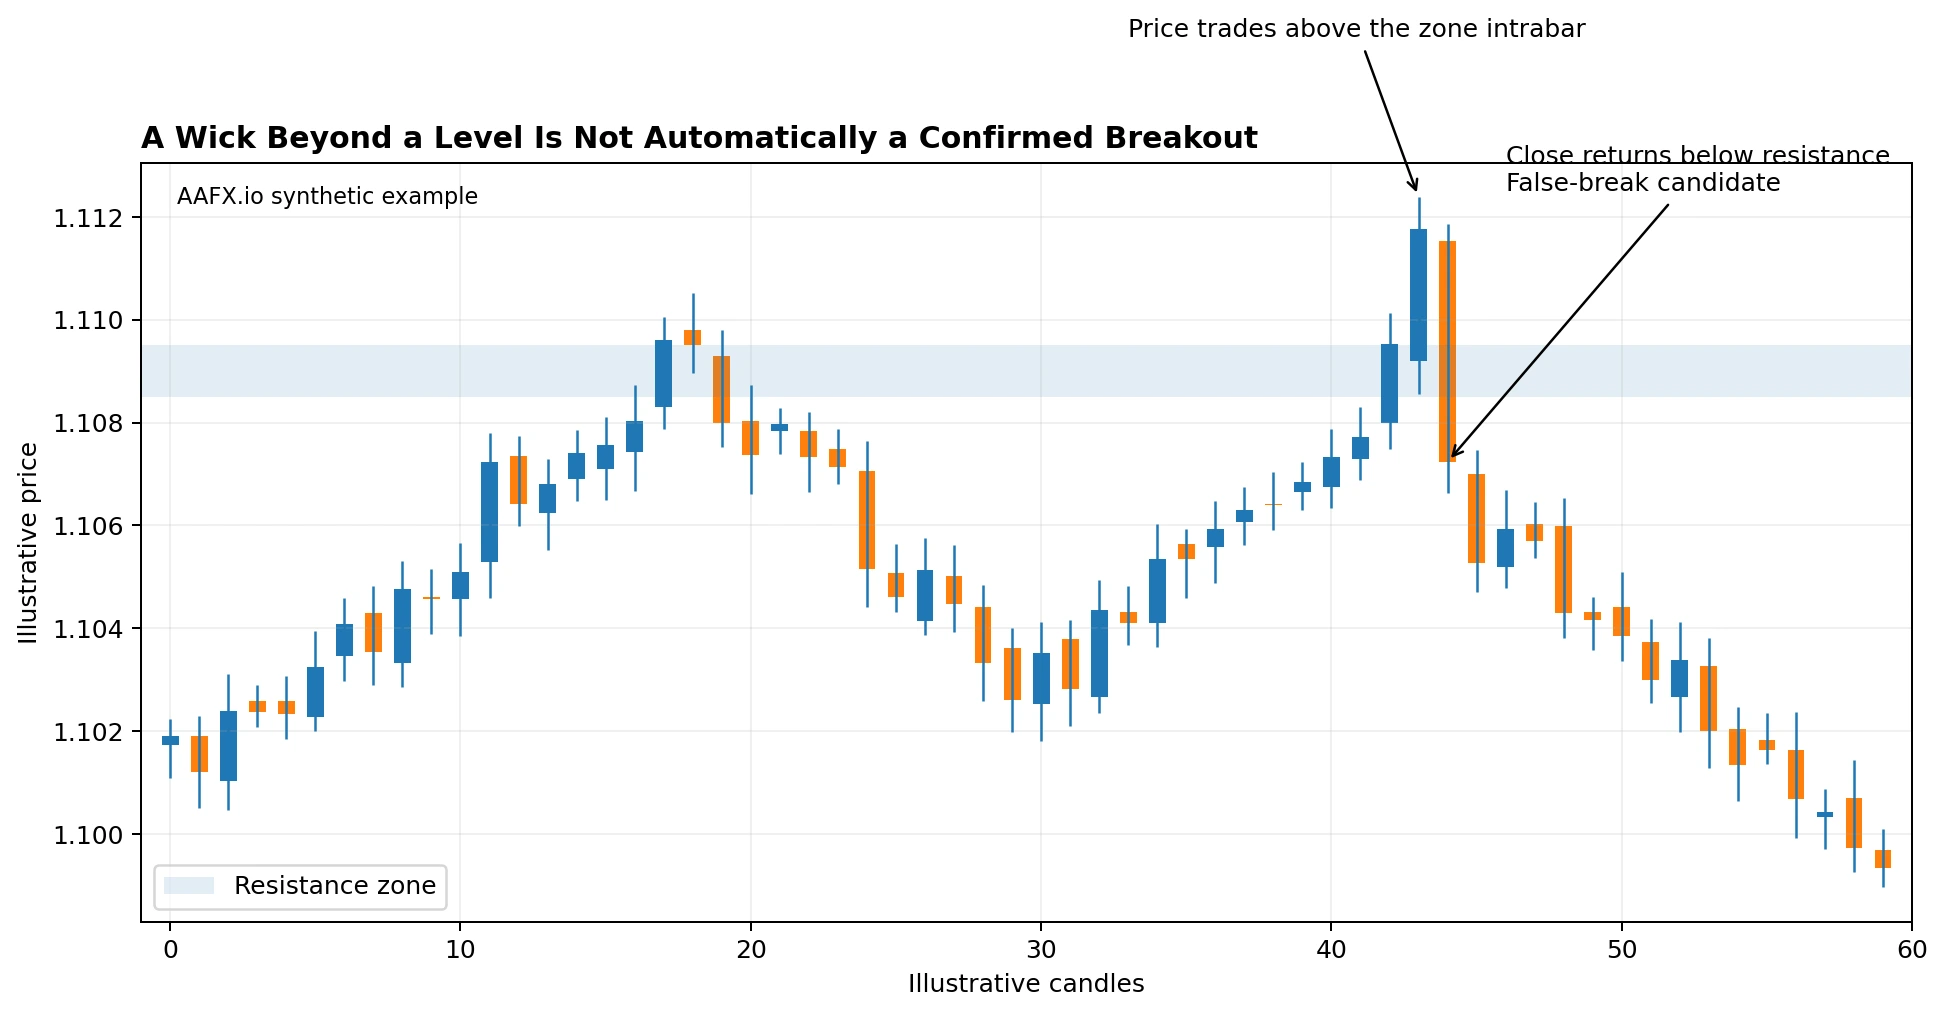
A candle can trade beyond resistance intrabar and still close back below it. Define what counts as a breakout before the move happens.
- Define the boundary of the support/resistance zone.
- Define what counts as a valid break: close, distance, volatility threshold or follow-through.
- Decide whether the strategy enters immediately or waits for a retest.
- If a retest occurs, look for the old level to hold in its new role.
- Place invalidation where the breakout thesis is clearly wrong, not at an arbitrary pip distance.
- Account for spread widening and slippage when volatility expands.
What Is a False Breakout?
A false breakout occurs when price moves beyond a support or resistance area but fails to establish follow-through and returns into the prior range. False breaks are especially important in forex because intraday wicks can be exaggerated by data releases, thin liquidity or spread changes. The correct response is not to label every failed breakout a manipulation event. The chart only proves that the attempted break did not hold under the strategy’s rule.
Using Support and Resistance for Entries, Stops and Targets
Support and resistance are most valuable when they organize the trade plan. A zone can define where the setup becomes interesting, where the thesis is invalid, and where the next opposing area may limit the move. This connects technical analysis directly with position sizing.
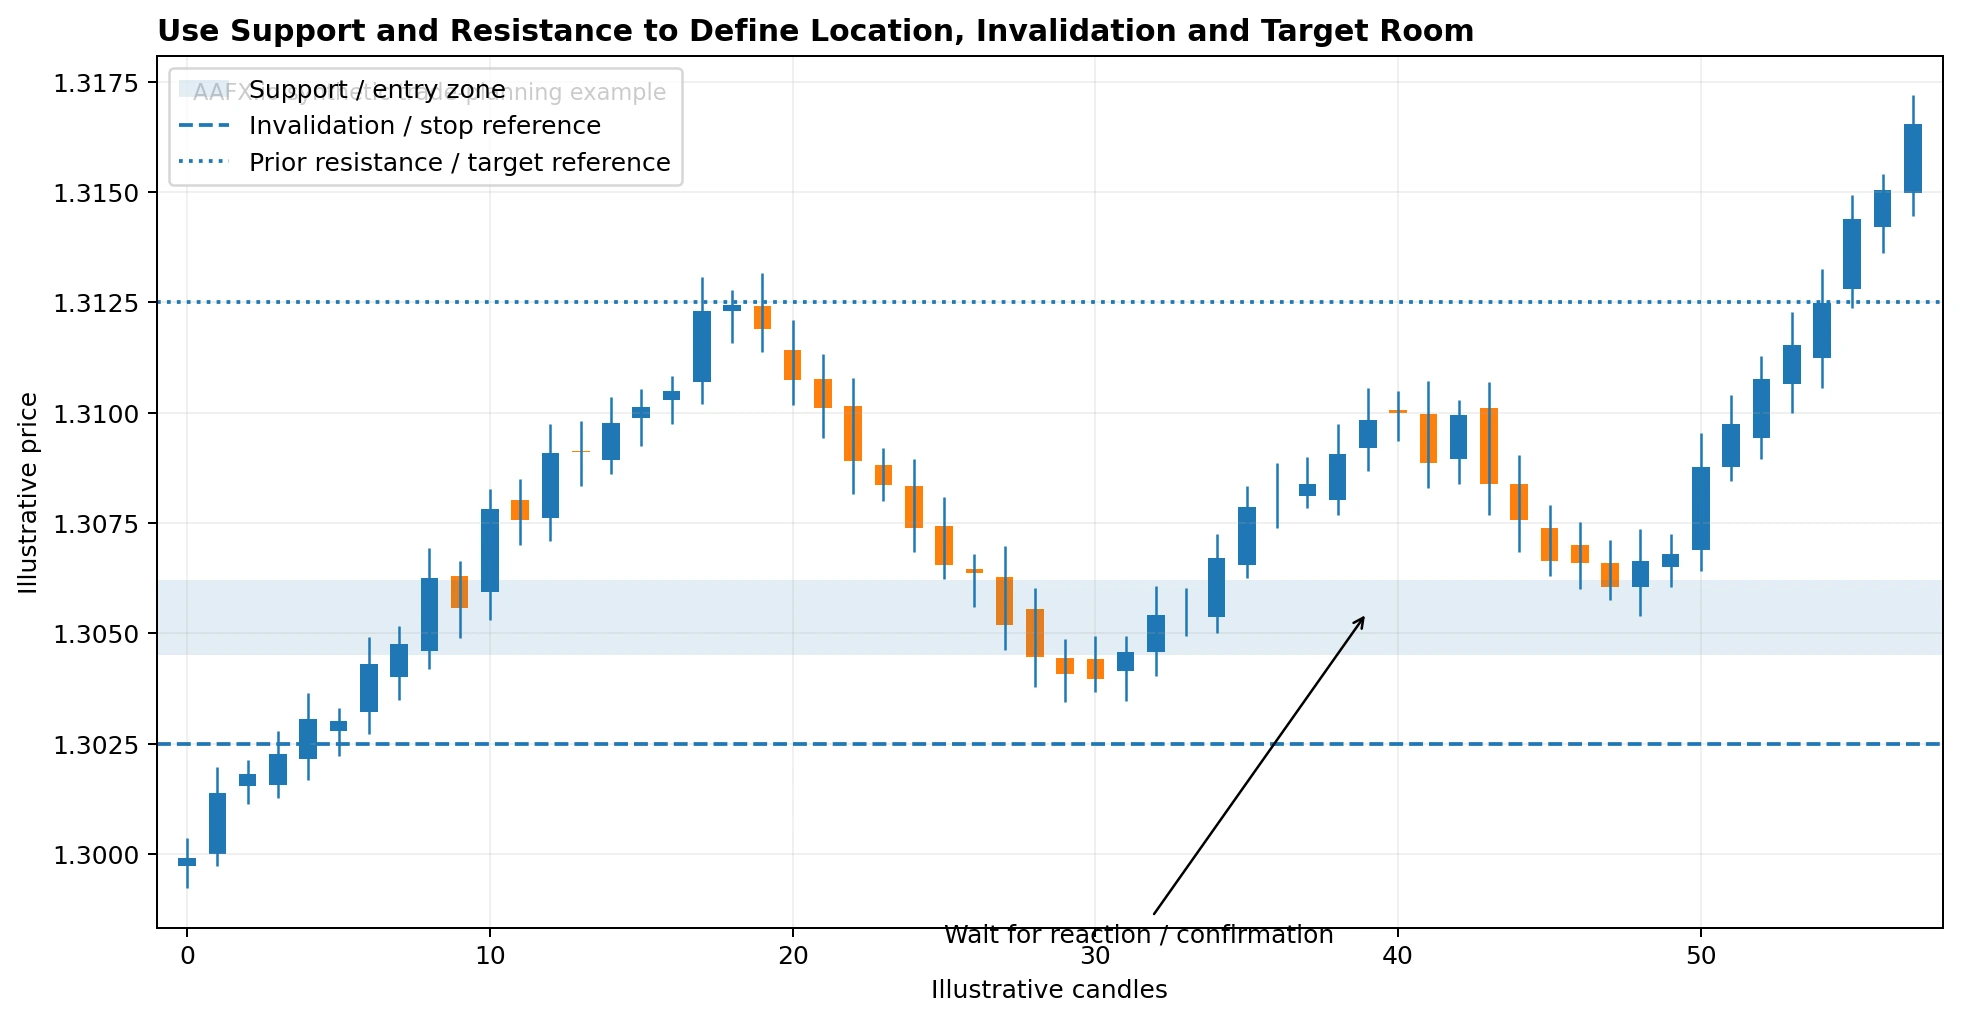
A complete support-based setup includes the entry area, an invalidation level beyond the zone, and enough room to the next resistance target. The numbers are illustrative, not a recommendation.
Where Should the Stop Go?
The stop belongs where the original setup is no longer valid. For a support-bounce trade, that may be beyond the support zone and the rejection low. For a breakout trade, it may be back inside the broken range or beyond the retest structure. A wider logical stop requires a smaller position if the planned dollar risk is unchanged.
The AAFX.io Risk Management and Position Sizing guide should govern the position-size calculation. Support and resistance determine location; the risk framework determines how much capital is exposed if the level fails.
Dynamic Support and Resistance
Some traders use moving averages, Bollinger Bands, VWAP or Ichimoku components as dynamic reference areas. These tools move with price, unlike horizontal swing levels. They can be useful, but they should not be mixed into one article as though every indicator creates the same kind of support. Moving averages should be assessed alongside the underlying price structure.
Does Volume Make a Support or Resistance Level Stronger in Forex?
Volume can add context, but spot forex has no single centralized global volume feed. Most retail spot-FX charts display tick volume or provider-specific activity. That means a high-volume reaction on one platform is not a complete measure of global currency-market participation. Futures volume can provide another perspective, but it represents exchange-traded currency futures rather than the entire OTC spot market.
Common Support and Resistance Mistakes
Drawing too many levels
If every swing is marked, the chart becomes a wall of lines and almost any move can be explained after the fact. Focus on the most obvious zones.
Treating one pip as a wall
Market reactions occur across areas. A small wick beyond the line does not automatically mean the level failed.
Buying support because it is “cheap”
Support is a technical reference, not proof that a currency is fundamentally undervalued.
Selling resistance because it is “expensive”
Resistance does not mean the currency pair is intrinsically overvalued.
Assuming more touches always mean stronger
Repeated reactions can increase visibility, but repeated tests can also weaken the zone.
Ignoring the trend
A support level inside a strong downtrend can fail repeatedly. Trend context changes the odds and the target room.
Ignoring scheduled news
A central-bank decision or major data release can overwhelm a technical level within seconds.
Entering before the breakout rule is met
If your system requires a close beyond resistance, an intrabar wick does not qualify.
Using Fibonacci or moving averages without price structure
An indicator line is not independent evidence simply because it appears on the chart.
Forgetting risk
A level can fail. If the position is too large, a normal technical failure becomes an account-management problem.
Use the forex trading tools and resources guide to organize your charting and event checks. When comparing chart feeds and execution features, see our forex trading platform comparison.
Support and Resistance Checklist Before a Trade
- Is the level a clear zone or am I forcing it onto the chart?
- What timeframe created the level?
- How recently did price react there?
- Is the market trending, ranging or highly volatile?
- Is the level aligned with a prior swing, round number or another independent reference?
- What exact rule confirms a bounce or breakout?
- What price action proves the setup wrong?
- Where is the next opposing support or resistance zone?
- Is there enough target room after spread and expected slippage?
- What economic event could invalidate normal technical behaviour?
- What position size fits the stop and risk budget?
Frequently Asked Questions
What is support in forex?
Support is a price area below the current market where a decline has previously slowed or reversed and where buying interest may appear again. It is a zone to watch, not a guaranteed floor.
What is resistance in forex?
Resistance is a price area above the current market where an advance has previously stalled or reversed and where selling interest may appear again.
Should support and resistance be lines or zones?
Zones are usually more realistic because price can wick through an exact level before reacting. A line can still be used as a visual reference inside the broader zone.
How many touches make support or resistance valid?
There is no universal number. Multiple reactions can make a level more visible, but repeated tests may also weaken it. Use a consistent rule and test it.
What happens when resistance breaks?
Broken resistance may become support on a retest, a concept called role reversal. It can also fail and fall back into the prior range.
What happens when support breaks?
Broken support may become resistance during a rebound. This is common enough to watch but not certain.
How do you confirm a support bounce?
Confirmation can be defined as a rejection candle, a close back above the zone, a higher low, or another rule. The key is to define the rule before the trade.
How do you confirm a breakout?
A strategy may require a candle close beyond the zone, a minimum distance, follow-through or a successful retest. A wick through a level is not automatically confirmation.
What is a false breakout?
A false breakout occurs when price moves beyond a level but fails to hold outside the zone and returns to the prior range.
Which timeframe is best for support and resistance?
No timeframe is universally best. Higher timeframes usually provide broader context, while lower timeframes can refine entries. Match the timeframe to the holding period.
Can moving averages act as support and resistance?
They can act as dynamic reference areas in some strategies, especially when many participants watch the same averages, but they are lagging indicators and can fail repeatedly in sideways markets.
Do round numbers work as support and resistance?
Round numbers can attract attention and order clustering, but they should be treated as areas to monitor rather than automatic entry points.
Is support and resistance reliable?
It is useful for organizing price structure and risk, but no level is guaranteed to hold or break. Reliability depends on the exact rule, market, timeframe, volatility and context.
Can beginners trade using only support and resistance?
A simple level-based framework can help beginners learn price structure, but a complete trading plan still needs risk management, position sizing, execution rules and awareness of market-moving events.
Bottom Line
Support and resistance are not prediction lines. They are decision zones that help traders answer three practical questions: where might price react, where is the idea wrong, and where is the next opposing area?
The most useful upgrade from basic support-and-resistance teaching is to stop treating every line as a permanent barrier. Think in zones, define the timeframe, expect false breaks, understand role reversal, and use confirmation rules that can be tested rather than improvised after the move.
AAFX.io uses support and resistance as part of a wider technical framework. Candlestick patterns can describe the reaction at the level, moving averages and Fibonacci can add secondary confluence, and the Risk Management and Position Sizing guide determines how much can be lost when the level fails. What would change the view is simple: if price breaks the invalidation area under the strategy’s rule, the level-based thesis is no longer valid.
Editorial Sources
- Fidelity: Using Technical Analysis to Plan Options Trades
- BabyPips: Support and Resistance
- BabyPips: Trading Support and Resistance
Risk warning: Forex and leveraged trading involve substantial risk. Support and resistance levels can fail, breakouts can reverse, and stop orders may execute away from the requested price during fast markets. This article is educational and is not personalised financial advice.
Sources & Methodology
Primary-source standard: Market-moving facts should link to original data releases, regulator notices, company filings or official project announcements whenever available. Secondary reporting is used for additional context, not as a substitute for original evidence.
Page last reviewed: