Quick Answer
A forex candlestick shows four prices for one chart period: the open, high, low and close. The body shows the distance between the open and close, while the upper and lower wicks show the period extremes. Candlestick patterns are named arrangements of one, two or three completed candles that traders use to describe rejection, indecision, momentum or a possible shift in control. Common patterns include the doji, hammer, shooting star, engulfing pattern, morning star and evening star. The pattern name alone does not predict the next move. Trend, support and resistance, timeframe, volatility, news risk and a separate risk plan determine whether a candle is useful.
What Is a Candlestick Chart?
A candlestick chart is a price chart that compresses the open, high, low and close of each period into one visual bar. On a 15-minute chart, every completed candle summarizes one 15-minute interval. On a 4-hour chart, every completed candle summarizes four hours. The same basic construction can be used for forex, stocks, indices, commodities and crypto.
Candlestick analysis is popular because it makes the relationship between the open and close immediately visible. A large body can show a strong directional move during that period. A long wick can show that price reached an extreme and then moved back before the candle closed. A small body can show that the open and close were close together. None of those observations, by itself, tells us what the next candle must do.
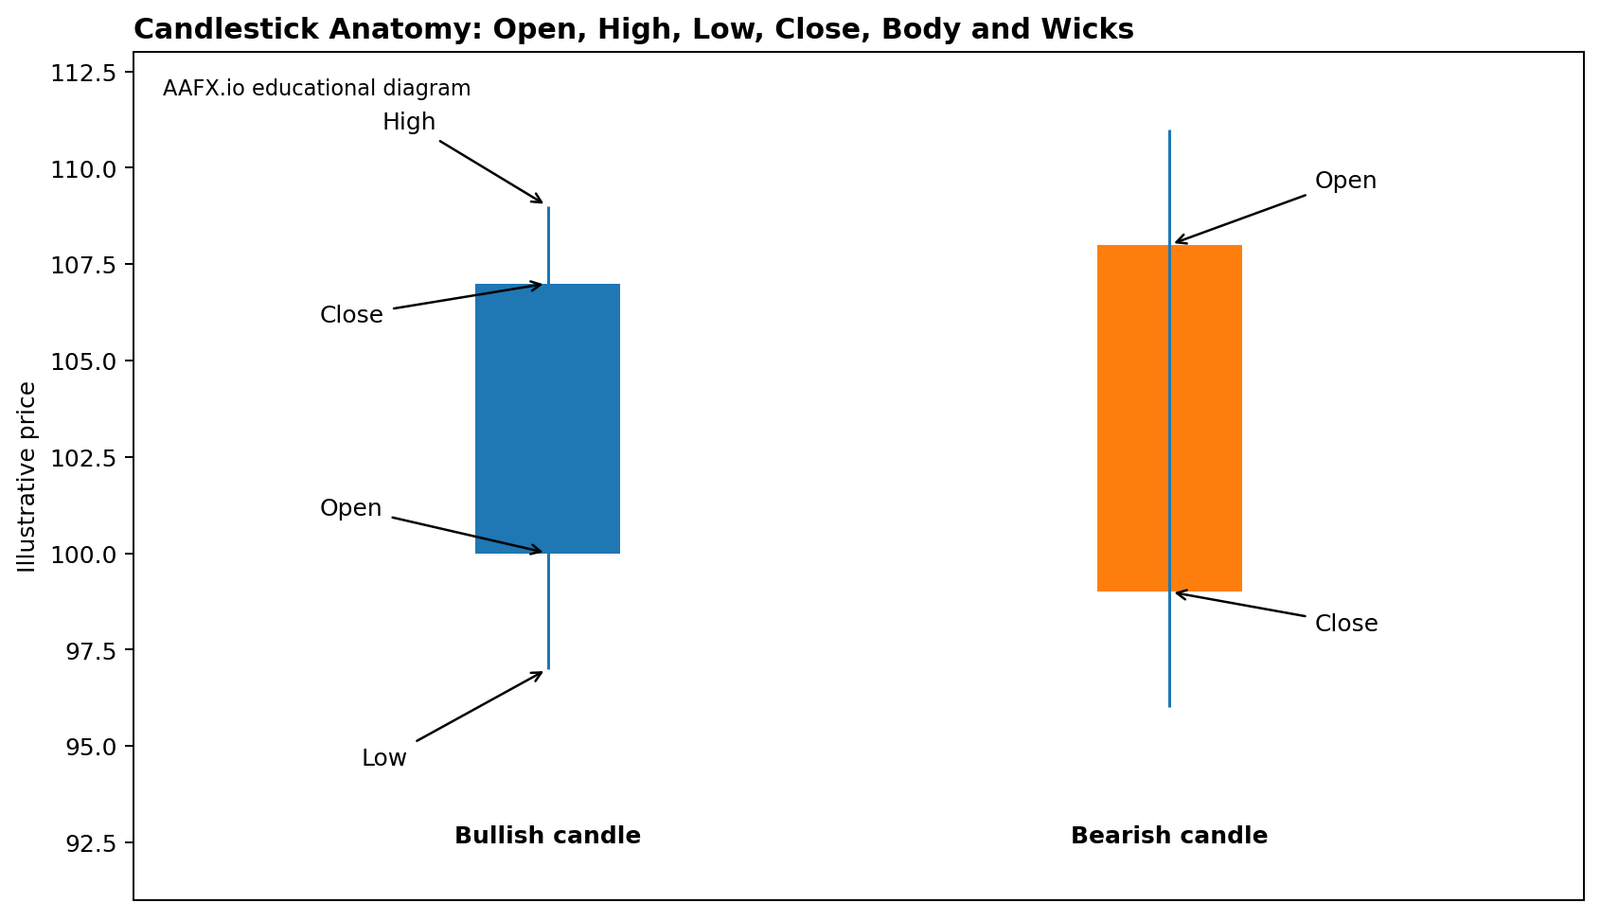
A standard candlestick records the open, high, low and close. Candle colors are chart settings; the OHLC relationship is what matters.
Where Did Candlestick Charts Come From?
Japanese candlestick techniques are commonly linked to the rice-market work of Munehisa Homma in the 18th century, although modern candlestick charting evolved over time rather than appearing in one finished form. Steve Nison helped popularize Japanese candlestick analysis in Western financial markets with Japanese Candlestick Charting Techniques in 1991. Today, candlesticks are built into virtually every major retail charting platform.
How to Read a Candlestick
Open
The first quoted price recorded for that chart interval.
High
The highest quoted price recorded during the interval.
Low
The lowest quoted price recorded during the interval.
Close
The final quoted price recorded when the interval ends.
Real body
The area between the open and close.
Wicks or shadows
The thin extensions from the body to the high and low.
A bullish candle closes above its open. A bearish candle closes below its open. That does not mean buyers or sellers controlled every transaction inside the interval. It simply describes where the candle finished relative to where it began.
Candlestick vs Line vs Bar Charts
| Chart type | Shows | Strength | Limitation |
|---|---|---|---|
| Line chart | Usually closing prices connected by a line. | Clean view of broad direction. | Hides the intraperiod open, high and low. |
| Bar chart | Open, high, low and close using an OHLC bar. | Detailed and compact. | Less visually intuitive for many beginners. |
| Candlestick chart | Open, high, low and close using bodies and wicks. | Makes the open-close relationship and rejection easy to see. | Can encourage traders to overinterpret attractive shapes. |
Are Heikin-Ashi and Renko Candlestick Charts?
They are related visual tools, but they should not be treated as ordinary OHLC candlesticks. A standard candlestick plots the actual open, high, low and close for the chosen interval. Heikin-Ashi calculates synthetic candle values from averaged current and previous data, which smooths trends but means the displayed open and close are not the raw market OHLC. Renko builds price bricks after a chosen amount of movement and largely ignores clock time.
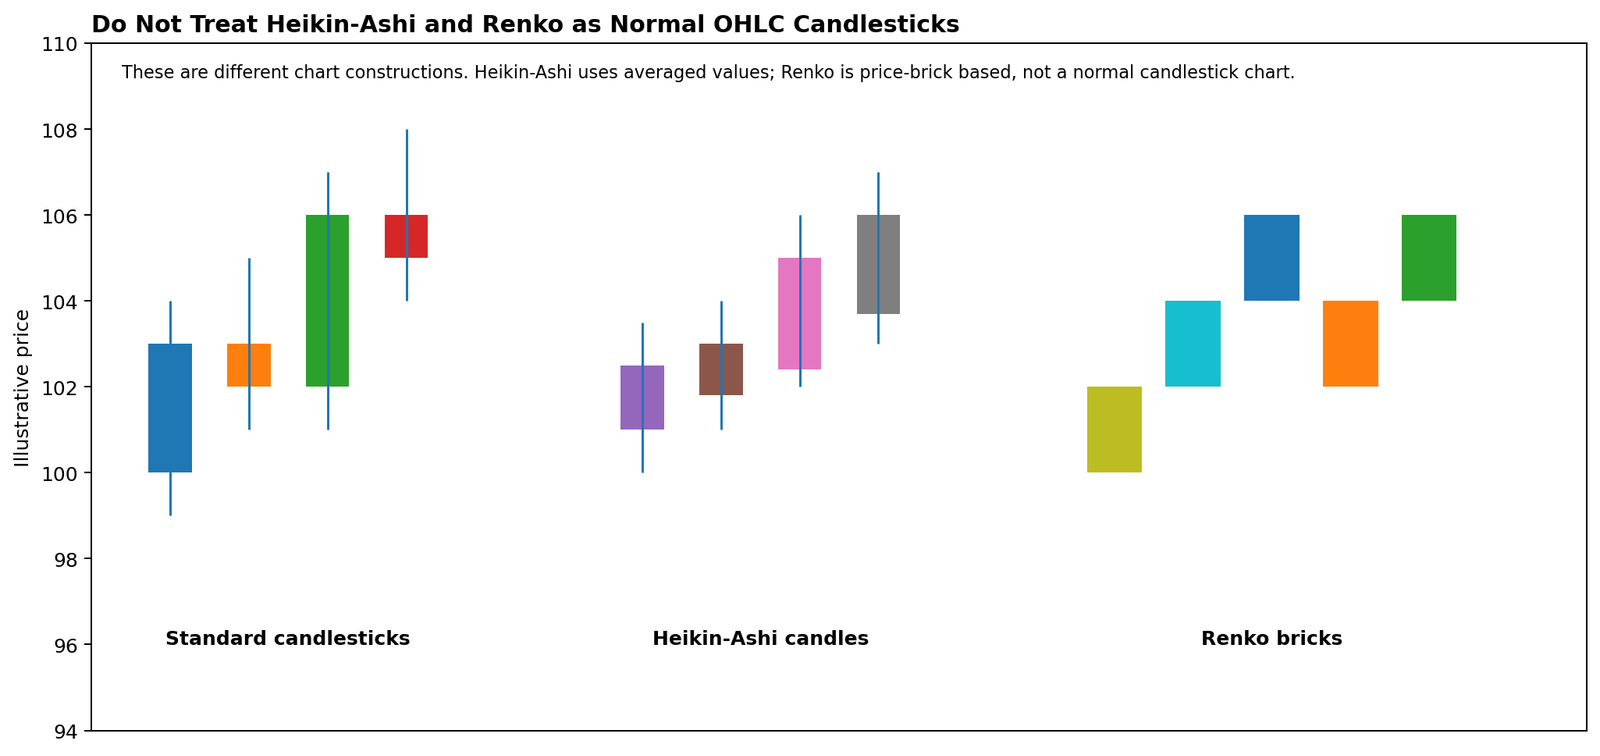
Standard candlesticks, Heikin-Ashi candles and Renko bricks are different chart constructions. Do not apply normal candlestick definitions to them without adjustment.
What Is a Candlestick Pattern?
A candlestick pattern is a defined candle shape or sequence that traders use to describe what happened during one or more completed periods. The most useful way to learn patterns is not to memorize dozens of names. Instead, identify the price behavior first: rejection, indecision, directional pressure, compression or a potential momentum shift.
Context changes the name. A candle with a small body and long lower wick may be called a hammer after a decline, but a very similar shape after an advance is called a hanging man. The shape is nearly the same; the preceding trend changes the interpretation.
Candlestick Patterns Cheat Sheet: 18 Key Setups
| Pattern | Candles | Typical context | What it describes |
|---|---|---|---|
| Doji | 1 | Any; stronger at meaningful levels | Open and close are very close, showing indecision or balance. |
| Spinning top | 1 | Any | Small body with wicks on both sides, showing limited net progress. |
| Marubozu | 1 | Trend / breakout context | Large body with little or no wick, showing strong one-directional movement. |
| Hammer | 1 | After a decline | Long lower wick and small body, showing rejection of lower prices. |
| Inverted hammer | 1 | After a decline | Long upper wick and small body, suggesting an attempted bullish shift that needs confirmation. |
| Hanging man | 1 | After an advance | Hammer-shaped candle at a high area, warning that lower prices were tested aggressively. |
| Shooting star | 1 | After an advance | Long upper wick and small body, showing rejection of higher prices. |
| Bullish engulfing | 2 | After weakness / near support | Second bullish real body covers the prior bearish real body. |
| Bearish engulfing | 2 | After strength / near resistance | Second bearish real body covers the prior bullish real body. |
| Bullish harami | 2 | After a decline | Small second body forms inside the first body, signaling contraction and possible shift. |
| Piercing line | 2 | After a decline | Bullish second candle closes well back into the prior bearish body. |
| Dark cloud cover | 2 | After an advance | Bearish second candle closes well back into the prior bullish body. |
| Tweezer bottom | 2 | After a decline | Two candles reject a similar low area. |
| Tweezer top | 2 | After an advance | Two candles reject a similar high area. |
| Morning star | 3 | After a decline | Strong bearish candle, smaller middle candle, then strong bullish recovery. |
| Evening star | 3 | After an advance | Strong bullish candle, smaller middle candle, then strong bearish reversal. |
| Three white soldiers | 3 | After decline / base | Three strong bullish candles showing sustained upward pressure. |
| Three black crows | 3 | After advance / top | Three strong bearish candles showing sustained downward pressure. |
Single-Candle Patterns
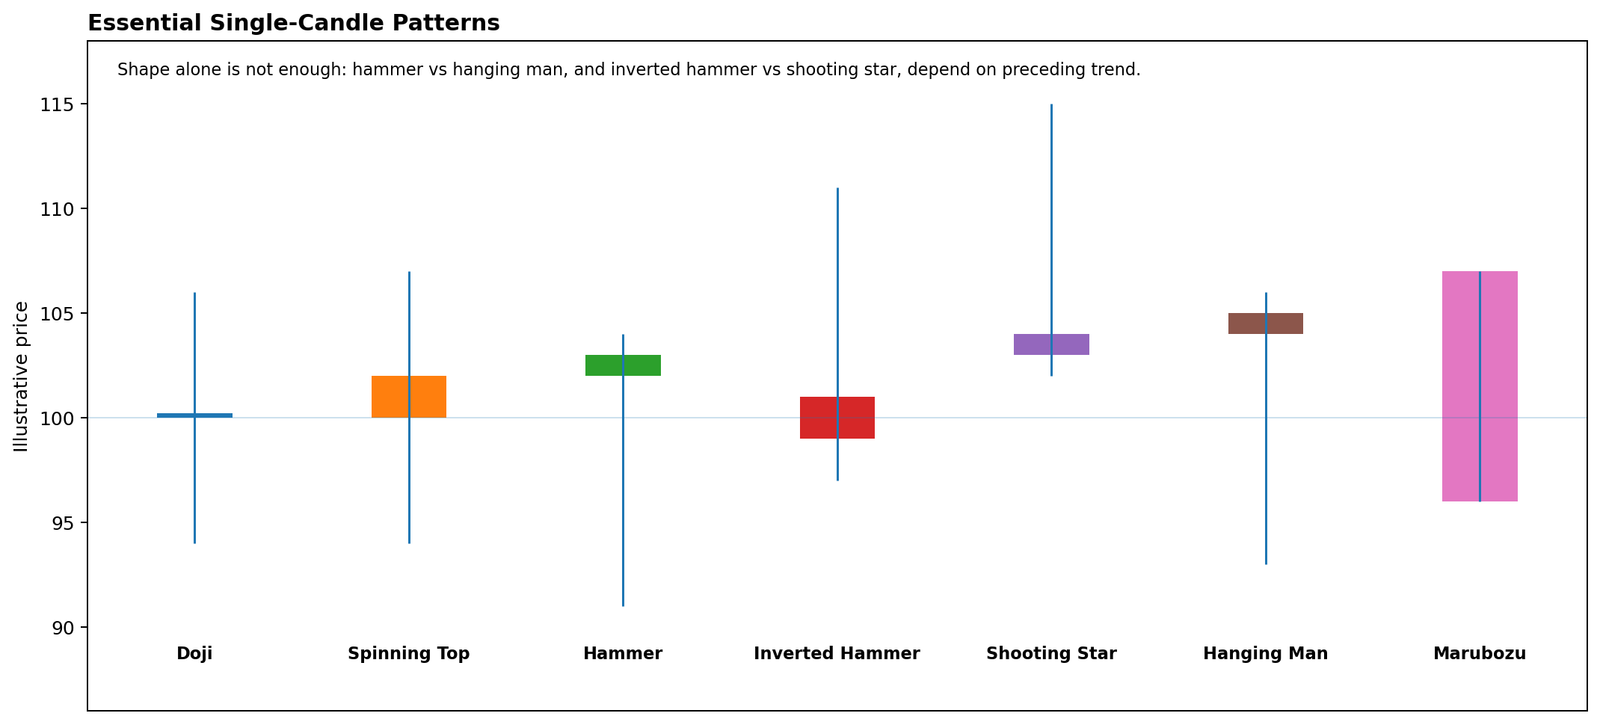
The same shape can mean different things in different locations. Hammer and hanging man share similar geometry; inverted hammer and shooting star also rely on trend context.
Doji
A doji forms when the open and close are very close. It shows that the candle finished near where it began, but the wicks reveal how far price traveled in between. A doji is best treated as an observation of indecision or balance, not an automatic reversal signal. At strong support or resistance, after an extended move, it can become more informative.
Dragonfly Doji and Gravestone Doji
A dragonfly doji has the open and close near the high of the candle with a long lower wick. After a decline, it can show rejection of lower prices. A gravestone doji has the open and close near the low with a long upper wick. After an advance, it can show rejection of higher prices. Neither is automatically bullish or bearish without location and preceding price action.
Hammer and Inverted Hammer
A hammer appears after a decline and has a small real body near the top of the candle with a long lower wick. It shows that sellers pushed price down but the candle recovered before the close. An inverted hammer appears after a decline with a long upper wick. It shows that buyers were able to push price upward during the period, although they did not keep all of the advance. Both require context and follow-through before being treated as a reversal setup.
Hanging Man and Shooting Star
The hanging man is the hammer-shaped counterpart that appears after an advance. The shooting star has a small body and long upper wick after an advance. Both can warn that the existing uptrend is losing control, but neither means price must reverse on the next candle.
Marubozu and Spinning Top
A marubozu has a large body with very small or absent wicks and describes strong directional movement during the candle. A spinning top has a relatively small body and wicks on both sides, which shows that price traveled in both directions without making much net progress. Compare each candle with recent volatility rather than judging body size in isolation.
Two-Candle Patterns
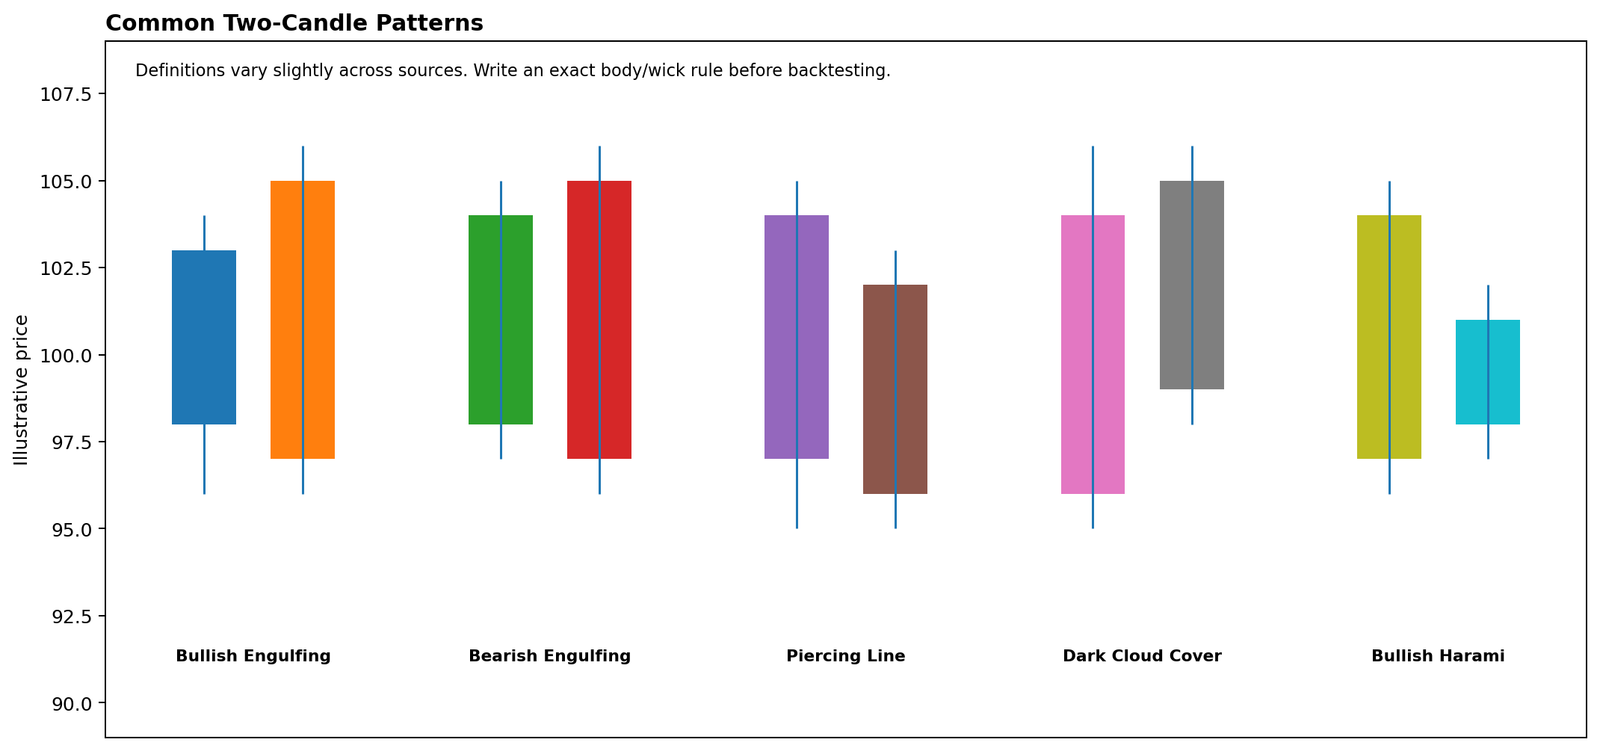
Popular two-candle structures include engulfing, piercing line, dark cloud cover and harami. Exact definitions should be written before testing.
Bullish and Bearish Engulfing
A bullish engulfing pattern typically consists of a bearish candle followed by a bullish candle whose real body covers the prior real body. A bearish engulfing pattern is the reverse. Some definitions require strict body engulfment, some allow equal opens or closes, and some traders incorrectly require the wicks to be engulfed. Decide the exact rule before backtesting so the setup is reproducible.
Piercing Line and Dark Cloud Cover
The piercing line is a bullish two-candle reversal structure after a decline. The second candle recovers deeply into the body of the first bearish candle, often beyond its midpoint under the textbook definition. Dark cloud cover is the bearish counterpart after an advance. In forex, the opening-gap conditions used in stock-market definitions may be less common, so traders need a precise rule suited to the market they test.
Harami and Tweezer Patterns
A harami has a smaller second real body contained within the first body, showing contraction after a larger directional candle. Tweezer tops and bottoms describe repeated rejection around a similar high or low. They are better treated as zones of repeated rejection than as exact one-tick matches.
Three-Candle Patterns
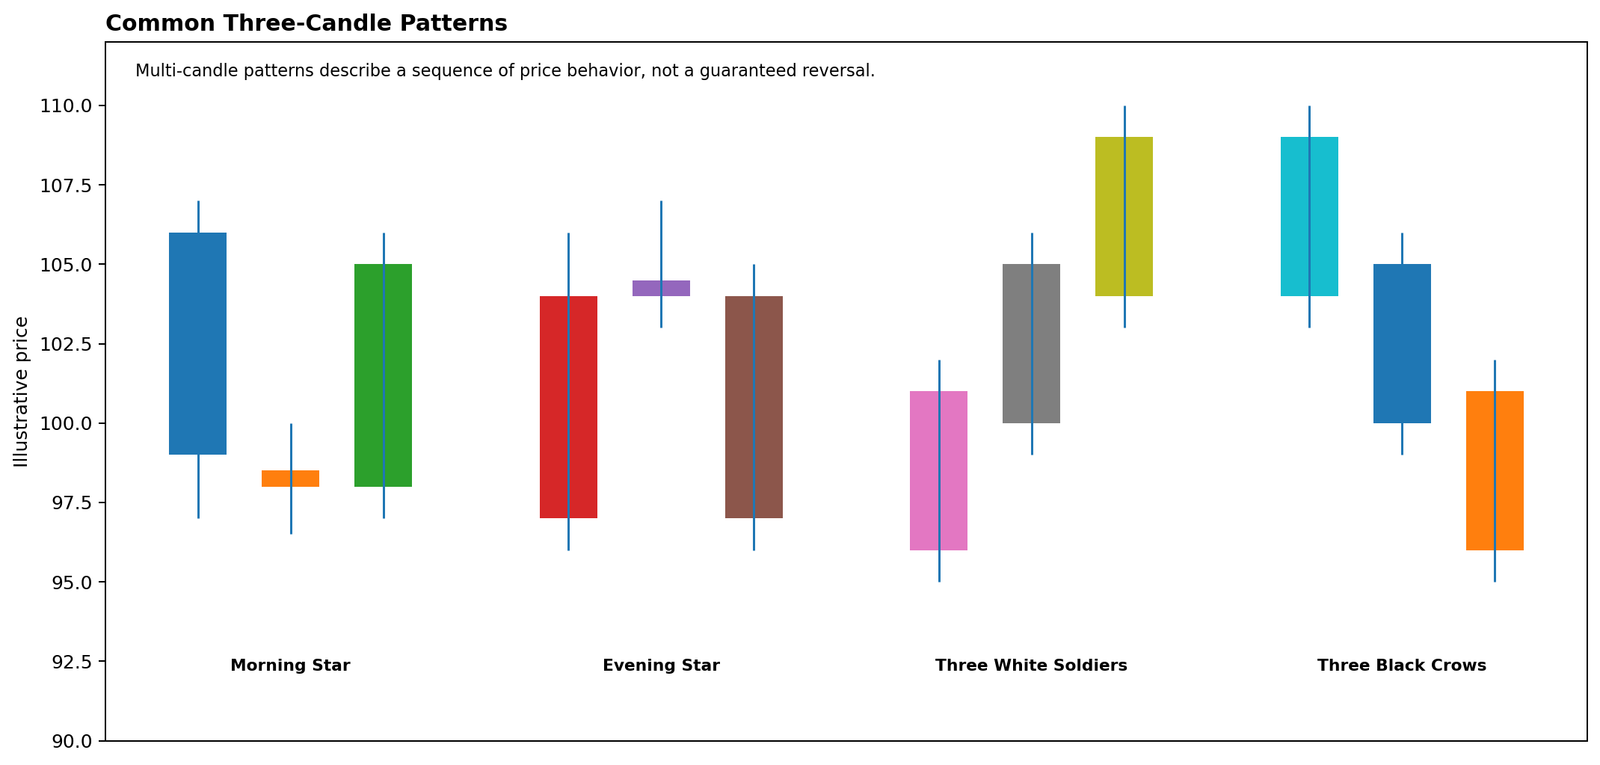
Morning star, evening star, three white soldiers and three black crows summarize a sequence rather than one isolated candle.
Morning Star and Evening Star
The morning star is a three-candle bullish reversal structure that begins with strong bearish movement, pauses with a smaller middle candle, then recovers with a strong bullish third candle. The evening star is the bearish mirror image. In continuously traded forex, the middle candle may not be separated by the textbook gaps often shown in stock charts.
Three White Soldiers and Three Black Crows
Three white soldiers consist of three strong bullish candles advancing in sequence, often after a weak or basing market. Three black crows are the bearish counterpart. The sequence shows sustained directional pressure, but whether the move continues depends on location, trend maturity and surrounding structure.
Why Context Matters More Than the Pattern Name
A hammer in the middle of a random range is not the same setup as a hammer rejecting a level that has held several times. A bearish engulfing candle inside a powerful uptrend is not automatically a short trade. The pattern is the trigger or observation. Market structure provides the context.
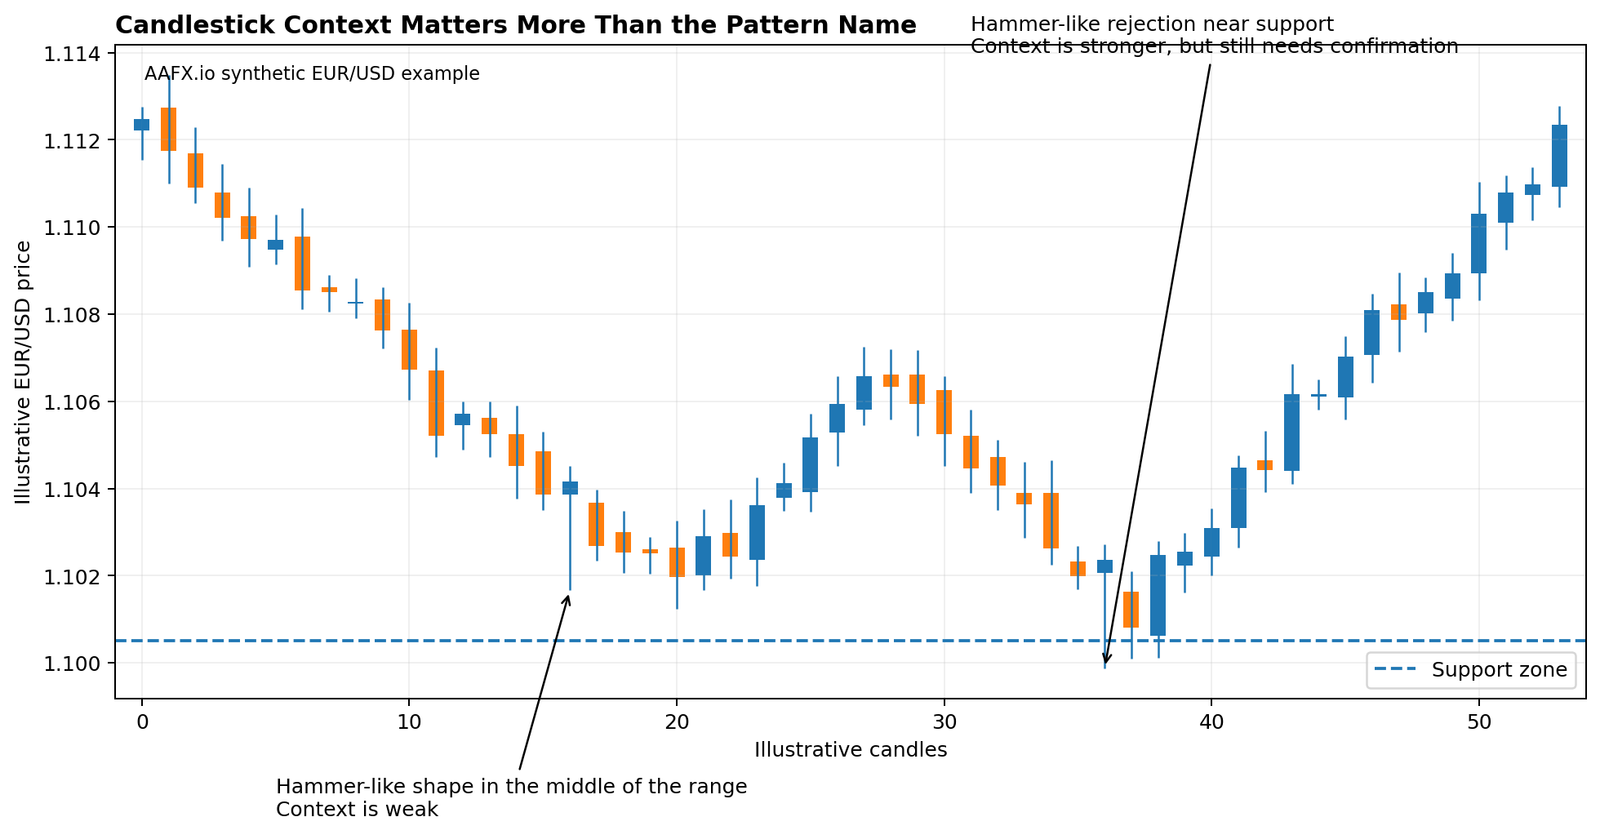
The candle shape is similar in both locations, but the support test changes the context. A pattern at a meaningful level can still fail, so confirmation and risk controls remain necessary.
| Context question | Why it matters | Example |
|---|---|---|
| What is the trend? | Patterns against a strong trend may fail more often or need stronger confirmation. | Shooting star after an extended rally vs inside a new uptrend. |
| Is price at support or resistance? | Rejection becomes more meaningful at a tested level. | Hammer at a prior swing low. |
| How volatile is the market? | Large wicks may be normal in high volatility rather than exceptional rejection. | News-driven forex candle. |
| Is the candle complete? | An unfinished candle can change shape before the period closes. | H1 doji becomes a large bullish candle before close. |
| Is there event risk? | A technical setup can be overwhelmed by a central-bank decision or data shock. | EUR/USD pattern just before ECB or US payrolls. |
| Is the market liquid? | Thin conditions can create erratic wicks and wider spreads. | Late-session or holiday trading. |
What Does Candlestick Confirmation Mean?
Confirmation is a rule that waits for additional evidence after the pattern forms. For a bullish setup, confirmation could mean the next completed candle closes above the pattern high. For a bearish setup, it could mean the next close breaks the pattern low. Confirmation sacrifices some entry speed in exchange for a more explicit rule. It does not guarantee success.
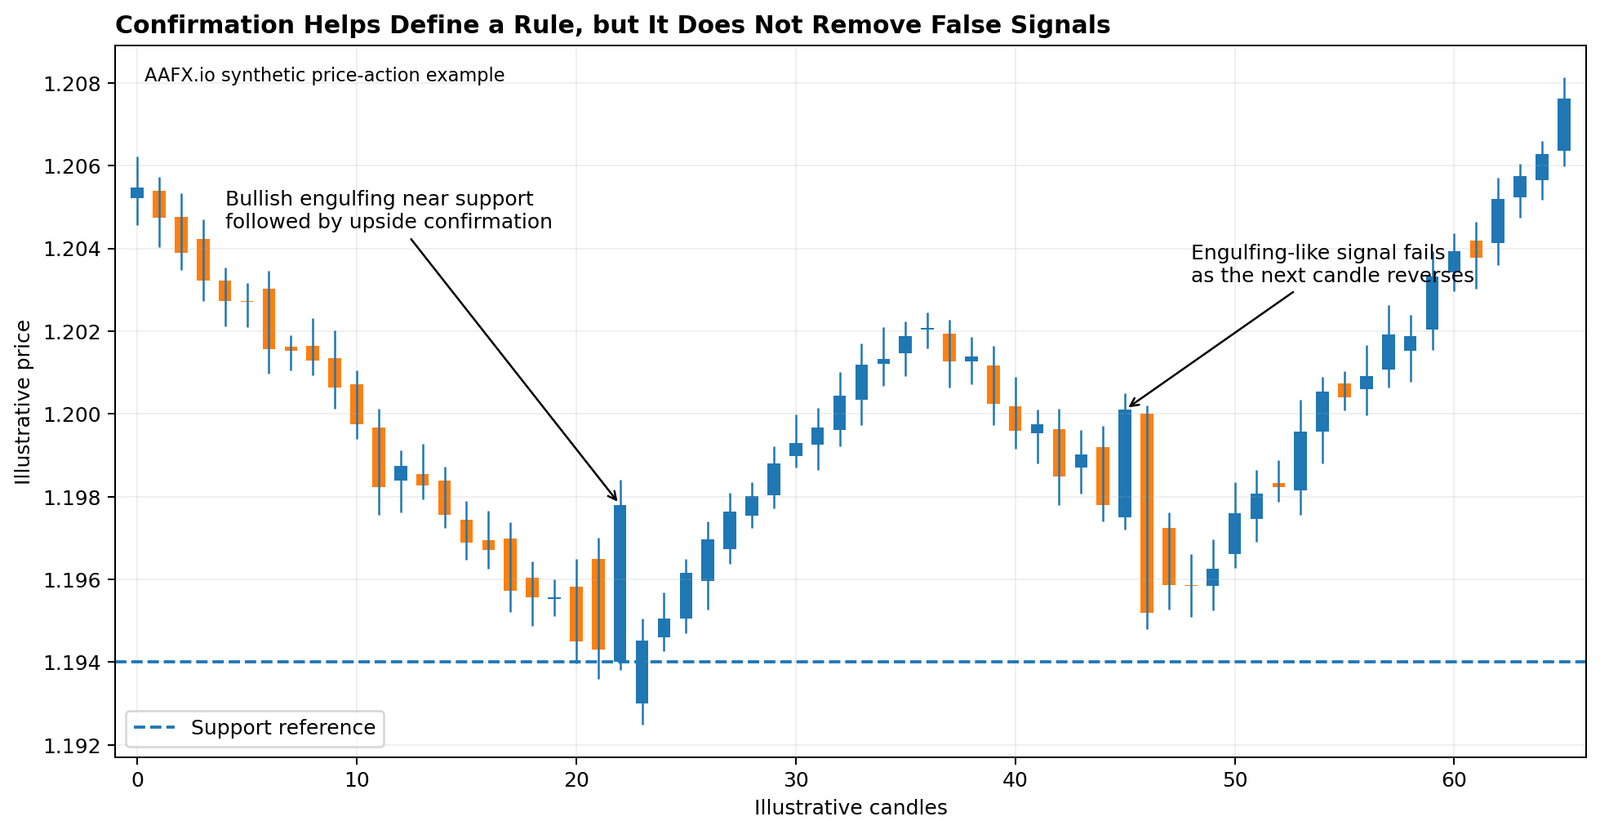
One engulfing setup receives follow-through while another fails immediately. A useful trading rule needs to include both successful and failed examples.
Should You Enter Before the Candle Closes?
If the strategy is defined around completed candlesticks, entering before the candle closes changes the strategy because the final OHLC values are not yet known. A candle that looks like a doji 10 minutes before the close can finish as a large directional candle. Intrabar trading can be valid, but it should be tested as a different rule.
How Timeframe Changes Candlestick Patterns
Candles are summaries of a chosen interval, so changing the timeframe changes the pattern. Four 1-hour candles combine into one 4-hour candle, and that 4-hour candle may have a completely different appearance from any individual H1 candle. This is why traders should avoid comparing pattern statistics across timeframes as though they are interchangeable.
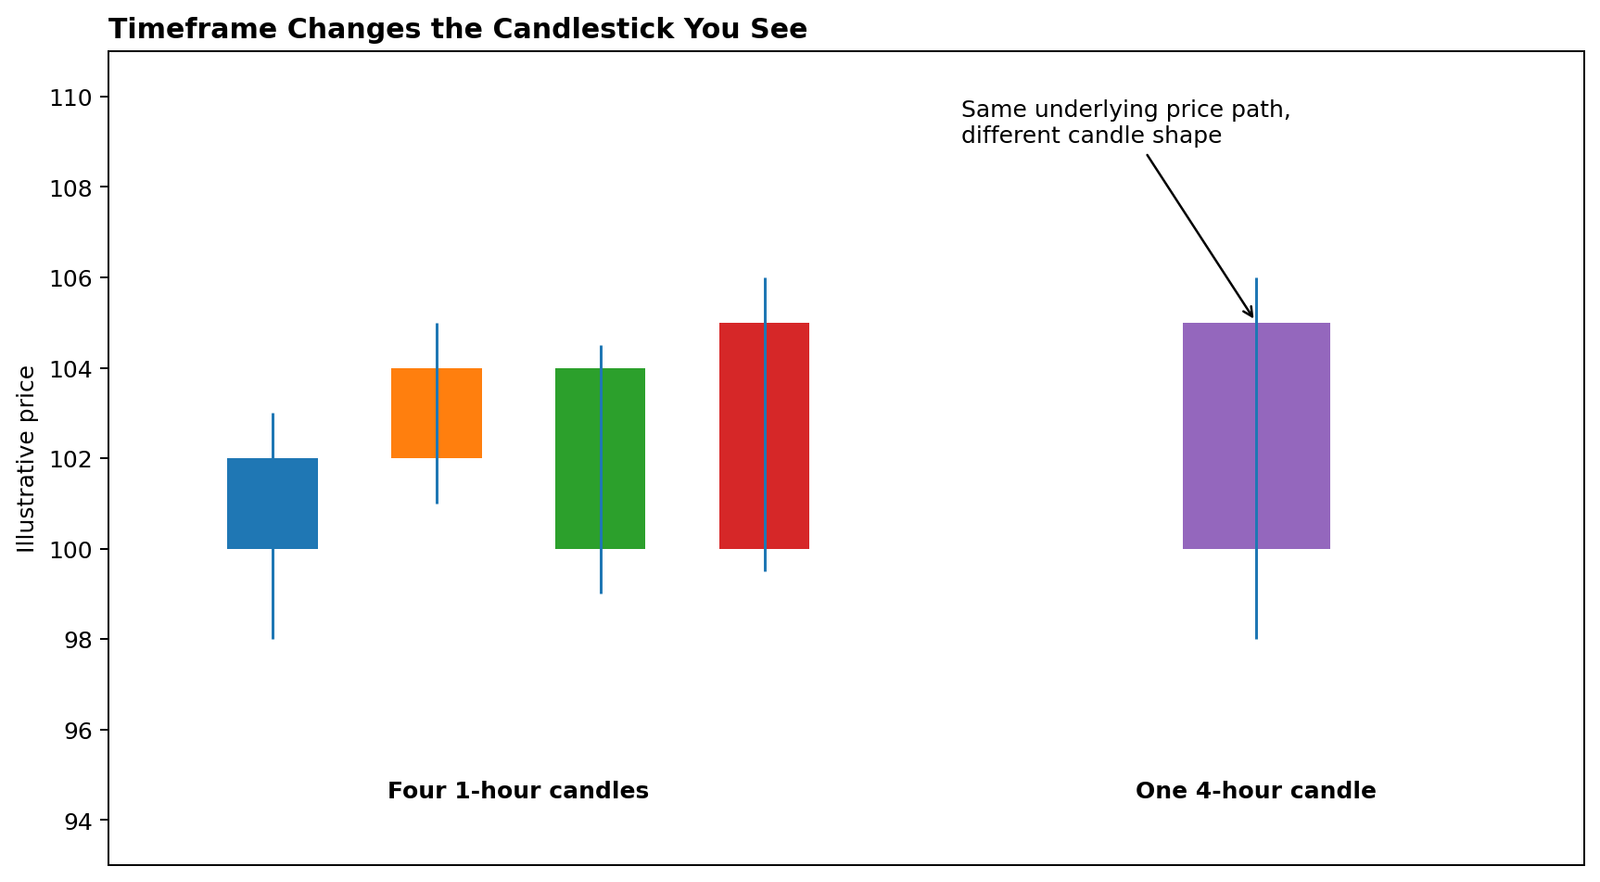
The same underlying price path can produce different candlestick information after timeframe aggregation.
There is no universal rule that higher-timeframe candles are always more reliable. Higher timeframes contain more price history per candle and fewer signals, while lower timeframes produce more observations and often more execution noise. Reliability must be tested for the exact instrument, timeframe, session and rule set.
What Is Different About Forex Candlesticks?
Forex Trades Nearly Around the Clock During the Week
The decentralized spot forex market trades continuously across global sessions during the business week. That means textbook opening gaps are generally less common than in exchange-traded shares that close every night. However, gaps can still appear around the weekly open, major shocks, illiquid periods or because of data-provider and broker feed differences.
Daily Candles Can Differ Between Brokers
A daily forex candle depends on where the platform defines the end of the trading day. Two brokers can use different server-time cutoffs, which can produce slightly different daily opens, highs, lows and closes. A pattern that appears on one feed may therefore look different on another. For reproducible analysis, use one consistent data source and document its session boundary.
Volume Is Fragmented in Spot FX
There is no single centralized exchange reporting all global spot forex volume. Retail platforms may show tick volume or provider-specific volume. Volume can still be useful as a local activity measure, but it should not be described as total global forex volume. This is important when adapting candlestick strategies that were originally designed for exchange-traded assets.
How to Use Candlestick Patterns in a Trading Plan
A candlestick pattern becomes useful when it answers part of a larger decision process. In my chart work, the first thing that catches my attention is usually location, not the candle name. I want to know whether the pattern appears at a level, after an extended move, during a pullback, or inside a random area with no obvious structure.
Define the market context first: trend, range, support, resistance and volatility.
Wait for the pattern to complete if your rule uses completed candles.
Use an exact pattern definition instead of visual guesswork.
Define confirmation, if the strategy requires it.
Place the invalidation level where the setup is objectively wrong.
Calculate position size from the stop distance and risk budget.
Check event risk, spreads and liquidity before execution.
Record both successful and failed patterns in the journal.
A pattern does not provide a complete trade by itself. Use the AAFX.IO Risk Management and Position Sizing guide to govern trade size, while the broader technical analysis guide explains how to combine candles with market structure and confirmation.
How to Backtest a Candlestick Pattern Properly
Backtesting requires numeric rules. “A long wick” is subjective. A testable rule might require the lower wick to be at least twice the real body, the real body to sit in the upper third of the candle range, and the previous 10 candles to show a decline. The exact numbers are illustrative, but the principle is essential: if two traders cannot identify the same pattern from the written rule, the test is not reproducible.
The test should include transaction costs, spread, slippage assumptions, signal frequency and every valid occurrence, not only attractive examples. Separate the pattern rule from the entry rule. For example, a hammer can be the setup and a break above its high can be the entry. That distinction helps avoid hindsight bias.
Common Candlestick Trading Mistakes
Trading every pattern you see
A doji, hammer or engulfing candle can appear frequently. Location and market structure decide whether it deserves attention.
Ignoring the preceding trend
The same candle geometry can have a different name and meaning after a rise versus after a decline.
Using unfinished candles
The shape can change dramatically before the candle closes.
Treating a pattern as a prediction
Candles describe completed price behavior. They do not know the next price.
Using stock-market gap rules mechanically in forex
Continuously traded forex often does not reproduce textbook opening gaps.
Assuming one broker feed is universal
Server-time boundaries and price feeds can change daily candle patterns.
Calling flags and triangles candlestick patterns
Flags and pennants, triangles and rectangles are chart structures formed over many candles. They belong in the chart-pattern cluster, not the candlestick-pattern list.
Overusing indicators for confirmation
Adding RSI, MACD, moving averages and several other indicators can create contradictory signals. Use a small number of clearly defined filters.
Ignoring failed patterns
A useful journal must record false signals and ambiguous examples, not just clean textbook winners.
Forgetting position size
Even a well-defined setup can damage the account if the size is too large for the stop distance.
Frequently Asked Questions
What is a candlestick in forex?
A forex candlestick summarizes the open, high, low and close for one chosen chart interval. The body spans the open and close; the wicks extend to the high and low.
What are the most important candlestick patterns?
For beginners, the most useful patterns to recognize include doji, hammer, shooting star, bullish and bearish engulfing, morning star, evening star, three white soldiers and three black crows. The pattern should always be read in market context.
Which candlestick pattern is the most reliable?
There is no universally most reliable candlestick pattern. Results depend on the exact definition, market, timeframe, trend, support or resistance context, costs and the way the rule was tested.
What is the difference between a hammer and a hanging man?
They have similar geometry. A hammer appears after a decline and is interpreted as lower-price rejection. A hanging man appears after an advance and can warn that sellers pushed price down during the candle.
What is the difference between an inverted hammer and a shooting star?
Both often have small bodies and long upper wicks. An inverted hammer appears after a decline; a shooting star appears after an advance.
Do candlestick colors matter?
No. Colors are platform settings. What matters is whether the close is above or below the open and how the body relates to the wicks.
Should I trade a candlestick pattern before it closes?
Only if your strategy is explicitly designed for intrabar signals. If your rule is based on completed candles, entering before the close means the final pattern is not yet known.
Why do candlestick patterns look different on different brokers?
Forex feeds and server-time boundaries can differ. That can change the daily open, high, low and close and therefore the appearance of some patterns.
Do candlestick patterns work on all timeframes?
Patterns can be defined on any timeframe, but performance can differ significantly. Lower timeframes have more signals and execution noise; higher timeframes have fewer signals. Test the exact timeframe you intend to trade.
Are Heikin-Ashi candles the same as normal candlesticks?
No. Heikin-Ashi uses averaged synthetic values and does not display the raw OHLC in the same way as a standard candle.
Is Renko a candlestick chart?
No. Renko uses price bricks based mainly on movement rather than fixed time intervals.
Can candlestick patterns predict market reversals?
They can highlight rejection, indecision or momentum changes, but they cannot guarantee a reversal. A complete setup also needs context, confirmation rules and risk management.
Bottom Line
Candlestick charts are a compact way to read price behavior. Learn the OHLC structure first, then focus on a manageable set of patterns rather than memorizing dozens of names. The most useful patterns are the ones you can define consistently and interpret in context.
Avoid rigid pattern definitions that ignore context. A dragonfly doji is not automatically bullish, a gravestone doji does not refer to yearly lows, a hammer is not a generic reversal candle, and a completed pattern should never be treated as proof of the next move.
AAFX.IO uses candlestick analysis as one layer of a broader technical process. Trend, support and resistance, volatility, confirmation and position sizing should decide whether a candle becomes a trade idea. What would change the view is equally important: if the confirmation fails or price breaks the invalidation level, the pattern thesis has failed regardless of how attractive the original candle looked.
Risk warning: Candlestick patterns are historical price formations, not guarantees of future performance. Forex and leveraged trading involve substantial risk. This material is educational and is not personalized financial advice.
Sources & Methodology
Primary-source standard: Market-moving facts should link to original data releases, regulator notices, company filings or official project announcements whenever available. Secondary reporting is used for additional context, not as a substitute for original evidence.
Page last reviewed: