
Solana extended its decline on Thursday, trading near $102.50 after failing to hold above its 50-day exponential moving average (EMA) at $107.13. Persistent withdrawals from Solana-focused exchange-traded funds (ETFs) are weighing on investor sentiment, even as tokenized equities on the blockchain continue to expand. SOL has fallen more than 13% in October, leaving traders focused on whether support around $97.95 can withstand further selling or whether the price will retreat toward $83.50.
Solana ETF Outflows Pressure Investor Demand
US spot Solana ETFs recorded approximately $1.29 million in net outflows on Wednesday, October 14, extending the withdrawal streak to eight consecutive trading sessions. The latest daily outflow followed roughly $24.81 million in redemptions during the previous week, according to figures reported from SoSoValue data.
ETF flows provide one measure of investor demand through regulated investment products. Repeated withdrawals can signal reduced appetite for exposure to SOL, although they do not establish that all institutional investors are selling or predict the token’s next move.
Meanwhile, Solana’s tokenized-equity market is growing. Data from Blockworks put tokenized equity supply on the network at approximately $611 million on Tuesday, spread across 1.42 million holders. Tokenized equities represent digital assets linked to shares or equity interests, allowing certain financial instruments to operate on blockchain infrastructure.
The contrasting trends highlight a key distinction: growth in network-based financial products does not necessarily translate into immediate buying demand for SOL itself.
SOL Tests Support Near $97.95
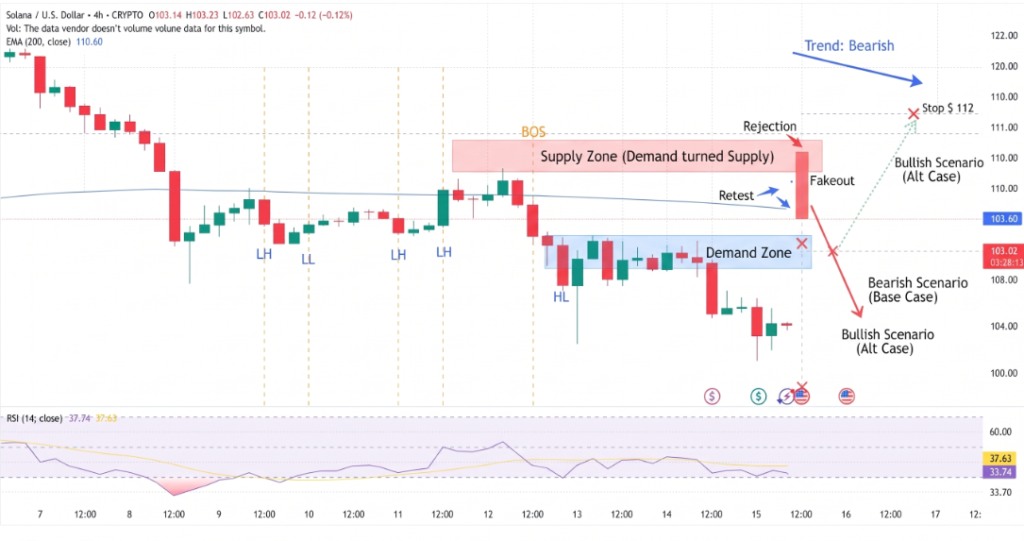
SOL’s technical structure remains weak after a double-top reversal near $122 in early October. The token has fallen below its 50-day EMA at $107.13, while the 200-day EMA at $97.95 represents the next major support level. A moving average tracks prices over a defined period and can help traders identify potential support or resistance.
Momentum indicators reinforce the cautious outlook. The Moving Average Convergence Divergence (MACD) remains below its signal line and the zero level, while the Relative Strength Index (RSI) near 35 reflects persistent selling pressure. An RSI near 30 can indicate oversold conditions, but it does not guarantee a rebound.
Key levels to watch include:
- Immediate support: $97.95, near the 200-day EMA.
- Lower target: $83.50, aligned with a previous May high.
- Initial resistance: $107.13, near the 50-day EMA.
- Major resistance: $122.94, around the September 25 high.
A sustained break below $97.95 would increase downside risk, while a recovery above $107.13 could ease near-term pressure.
Can Solana Recover From the Selloff?
The short-term outlook depends on whether buyers defend the 200-day EMA and ETF withdrawals begin to moderate. Continued development in tokenized equities may support Solana’s longer-term adoption, but it cannot eliminate near-term price risks.
Conclusion:
Solana remains vulnerable while it trades below $107.13 and faces persistent ETF outflows. A break beneath $97.95 could open the way toward $83.50, whereas a sustained recovery above the 50-day EMA would improve the technical picture. Investors should monitor fund flows, market momentum and support levels rather than treating ecosystem growth alone as a signal of an immediate price recovery.
Sources & Methodology
Primary-source standard: Market-moving facts should link to original data releases, regulator notices, company filings or official project announcements whenever available. Secondary reporting is used for additional context, not as a substitute for original evidence.
Page last reviewed: