Zcash extended its decline on Thursday after losing roughly 6% in the previous session, as stronger-than-expected US inflation weighed on cryptocurrency markets. ZEC traded near $1,111, putting last week’s low around $1,115 under pressure. A sustained break below that level could expose the privacy-focused cryptocurrency to further losses toward $1,050 and the psychologically important $1,000 mark. Renewed demand for Grayscale’s Zcash-focused exchange-traded fund offered a potential counterweight, but technical indicators continued to favor sellers.
Hot US Inflation Weighs on ZEC
The US Consumer Price Index rose 3.7% year over year in September, exceeding the 3.6% forecast cited in the market report. Monthly inflation increased 0.6%, while core CPI, which excludes food and energy, rose 2.6% annually and 0.3% monthly. The stronger headline reading renewed concerns that interest rates could remain elevated for longer.
Higher borrowing costs can reduce appetite for speculative assets as investors reassess the potential returns from holding cryptocurrencies. Bitcoin’s struggle around the $80,000 threshold adds to the risk of broader selling spilling into smaller tokens, including Zcash.
Fund flows offered a more constructive signal. Grayscale’s Zcash ETF, which trades under the ticker ZCSH, was reported to have attracted approximately $3.68 million on Wednesday after consecutive sessions of outflows. However, ETF flow estimates can vary by data provider and reporting cutoff, so the figure should be treated as a reported daily reading rather than proof of a sustained institutional buying trend.
ZEC Tests $1,115 Support
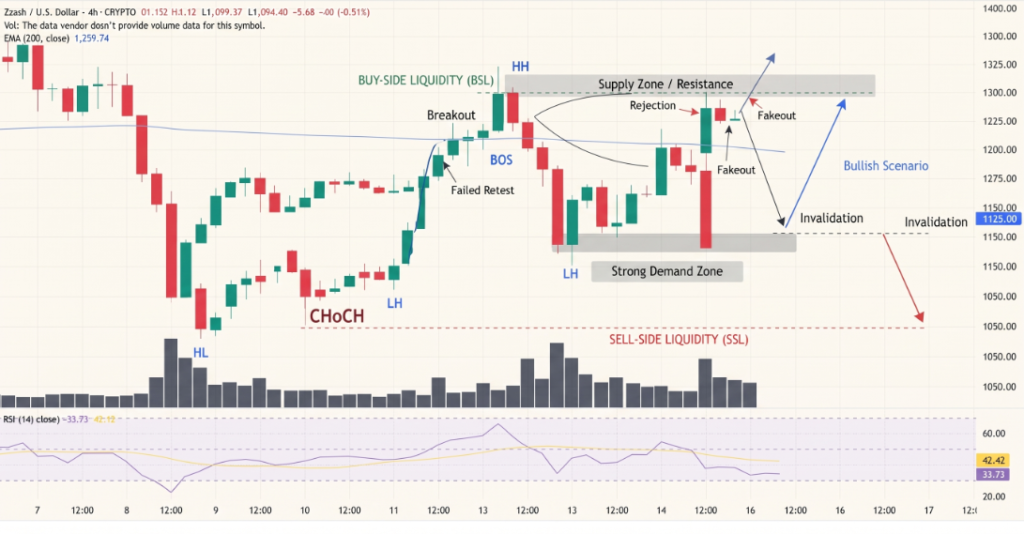
ZEC traded well below its recent late-September peak of $1,698, reflecting a sharp correction. On the four-hour chart, the price remained below the 50-period exponential moving average (EMA) near $1,242 and the 200-period EMA around $1,264. These averages track recent price trends and can act as resistance when an asset trades beneath them.
Momentum indicators also pointed to continued weakness. The Moving Average Convergence Divergence (MACD) remained below zero, while the Relative Strength Index (RSI) hovered near 34. An RSI near 30 can indicate oversold conditions, but it does not by itself confirm that a recovery is imminent.
The main levels traders are watching include:
- Immediate support: $1,115, the previous weekly low.
- Next downside levels: $1,050 and $1,000.
- Extended downside target: $888 if selling accelerates.
- Initial resistance: $1,242, followed by $1,264.
A sustained four-hour close below $1,115 would strengthen the bearish case, although support breaks can produce false signals.
Can ETF Demand Reverse the Trend?
The immediate outlook depends on whether buyers can defend support despite persistent macroeconomic pressure. Continued ETF inflows could help stabilize sentiment, but one positive session is insufficient to establish a lasting shift in demand.
Conclusion:
Zcash remains vulnerable while it trades below $1,115 and its key moving averages. A confirmed breakdown could bring $1,050 and $1,000 into view, while a recovery above $1,242 would be an early sign of improving momentum. Inflation data, broader crypto-market direction and sustained ETF flows will help determine whether ZEC extends its correction or begins to stabilize.
Sources & Methodology
Primary-source standard: Market-moving facts should link to original data releases, regulator notices, company filings or official project announcements whenever available. Secondary reporting is used for additional context, not as a substitute for original evidence.
Page last reviewed: