The US Dollar Index (DXY) climbed toward 103.75 on Wednesday, approaching its highest level since April 2025 as investors increased bets on another Federal Reserve (Fed) interest-rate increase in December. Stronger US economic data, elevated Treasury yields and geopolitical uncertainty have supported demand for the Greenback. Attention is now turning to the minutes of the Fed’s October meeting, which could provide further insight into policymakers’ willingness to tighten monetary policy. With DXY approaching 104.00, the next move will depend on whether the Dollar’s fundamental support can overcome increasingly stretched technical conditions.
Fed rate expectations strengthen Dollar demand
The US Dollar has gained ground as investors reassess the outlook for monetary policy. Markets are increasingly confident that the Fed will raise borrowing costs by 25 basis points in December, with expectations for additional increases also influencing currency positioning.
According to Reuters, traders were pricing in a 95.7% probability of a quarter-point December increase on Wednesday. The outlook has been supported by persistent inflation concerns and comments from Fed officials indicating that further tightening may be necessary.
Treasury yields have reinforced the Dollar’s appeal. The US 10-year Treasury yield stood near 5.10% on November 17, while the two-year yield was around 4.80%, according to US government data. Higher yields can attract international investors seeking better returns on Dollar-denominated assets.
The Federal Reserve’s October meeting minutes are the next major event for currency markets. Investors will examine the discussion for clues about inflation risks, economic conditions and the potential scale of future rate increases.
Geopolitical tensions in the Middle East are providing another source of support. Periods of heightened uncertainty often increase demand for traditional safe-haven assets, including the US Dollar.
DXY technical outlook points to 104.00
The Dollar Index remains in a strong short-term uptrend after breaking above the 102.35-102.40 resistance region. On the four-hour chart, DXY is trading comfortably above its 200-period Exponential Moving Average (EMA), reinforcing the broader bullish structure.
However, momentum indicators suggest the rally may be becoming stretched. The Relative Strength Index (RSI) is around 75, placing it above the conventional overbought threshold of 70. Meanwhile, the Moving Average Convergence Divergence (MACD) has slipped slightly below zero, indicating that upward momentum may be losing strength.
The technical picture therefore supports further gains but also raises the risk of a corrective pullback.
Key DXY support and resistance levels
The 104.00 psychological level is the next major upside objective for buyers. A sustained move above it would strengthen the bullish outlook and signal that demand remains strong despite stretched momentum.
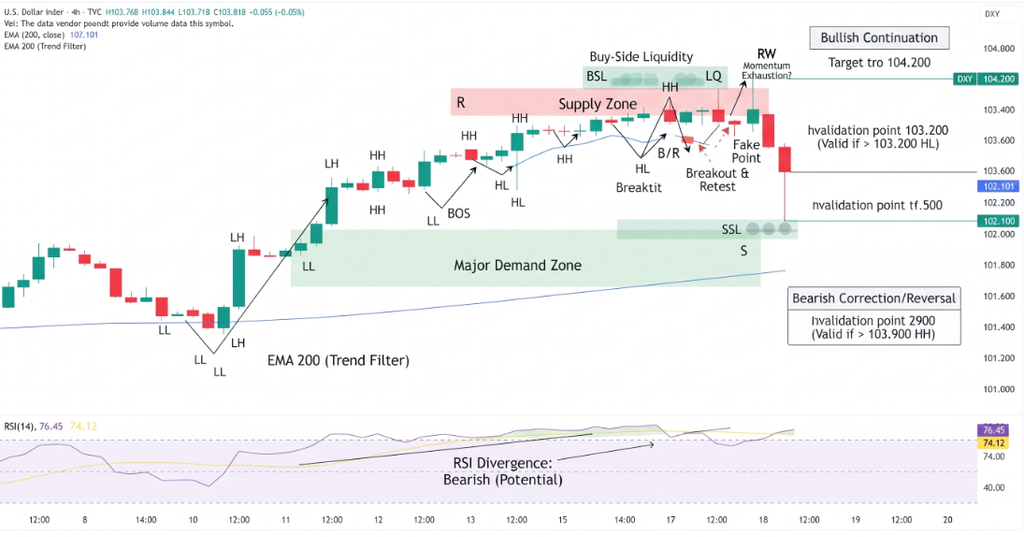
On the downside, traders will monitor these levels:
- 103.35: Immediate support near the recent swing low.
- 103.00: Psychological support and an important downside threshold.
- 101.98: Four-hour 200-period EMA and deeper support.
- 104.00: Immediate upside target for Dollar bulls.
A break below 103.00 could accelerate selling toward the 200-period EMA, while a hold above 103.35 would preserve the immediate bullish structure.
Conclusion
The US Dollar Index remains supported by expectations of higher interest rates, elevated Treasury yields and safe-haven demand. A move toward 104.00 is possible if the FOMC minutes reinforce the Fed’s hawkish stance. However, an overbought RSI and weakening MACD momentum leave DXY vulnerable to a short-term correction before another attempt at higher levels.
Sources & Methodology
Primary-source standard: Market-moving facts should link to original data releases, regulator notices, company filings or official project announcements whenever available. Secondary reporting is used for additional context, not as a substitute for original evidence.
Page last reviewed: