XRP extended its decline on Monday, trading around $1.09 after losing more than 10% last week. Weakening institutional demand, bearish derivatives positioning and a challenging U.S. interest-rate outlook are adding pressure to the cryptocurrency. U.S. spot XRP exchange-traded funds (ETFs) recorded $529,510 in weekly net outflows, ending a two-week run of inflows. With technical indicators pointing to continued weakness, traders are watching the psychological $1.00 level as the next major support.
XRP ETF Outflows Signal Cooling Demand
Institutional appetite for XRP weakened during the week ended November 6. Data from SoSoValue showed that U.S. spot XRP ETFs recorded approximately $529,510 in net outflows, reversing the previous two weeks of positive flows.
The weekly withdrawal was concentrated in one trading session. Canary Capital’s XRPC fund recorded an outflow of roughly $529,500 on November 2, while the funds reported no net flows during the following four sessions. This suggests that the weekly figure reflected a single withdrawal rather than continuous selling throughout the week.
Even so, the reversal highlights a pause in institutional demand. If investors continue reducing exposure, ETF flows could become an additional source of pressure for XRP, particularly while broader market sentiment remains weak.
Bearish Metrics and Fed Outlook Weigh
Derivatives data also points to caution among XRP traders. CoinGlass placed XRP’s long-to-short ratio at 0.91 on Monday, close to its lowest reading in more than a month. A ratio below one indicates that short positions outweigh long positions among the accounts measured.
Meanwhile, CryptoQuant data points to large whale orders and sell-side dominance across XRP’s spot and futures markets. These indicators suggest that selling pressure remains elevated, although positioning data alone cannot confirm the next price direction.
The U.S. economic outlook adds another challenge. October Nonfarm Payrolls increased by 165,000, exceeding forecasts of 65,000, while unemployment declined to 4.1%. The stronger report reinforced expectations that the Federal Reserve could keep interest rates higher for longer.
Market-implied odds of a December rate increase rose to around 78% after the jobs report, according to Reuters. Higher interest rates can reduce demand for non-yielding assets such as XRP by making interest-bearing investments more attractive.
XRP Technical Analysis: $1 in Focus
XRP traded near $1.095 in Monday’s market snapshot, remaining below its 50-day, 100-day and 200-day exponential moving averages (EMAs), clustered between $1.302 and $1.360. The positioning of these averages indicates that the broader trend remains under pressure.
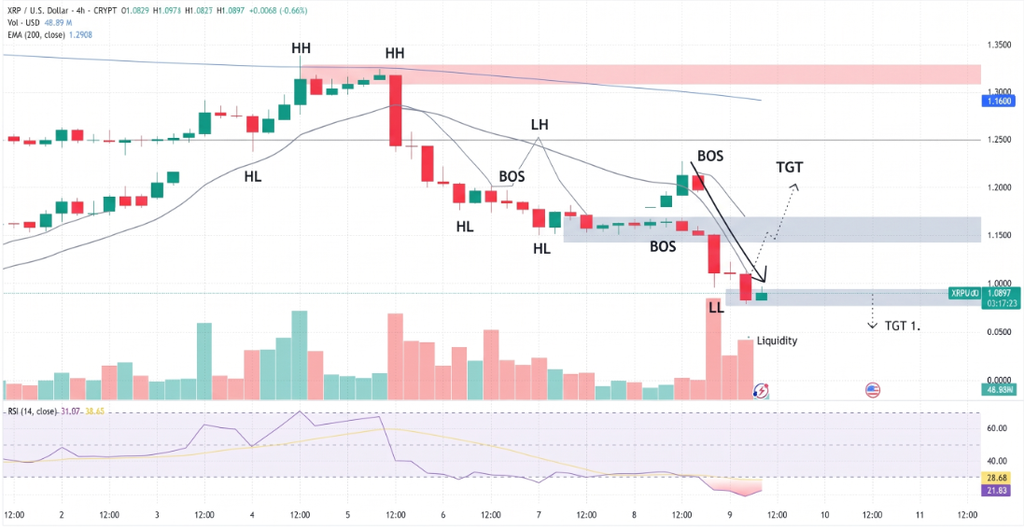
The daily Relative Strength Index (RSI) stood at 26, placing XRP in oversold territory. However, an oversold reading does not guarantee a rebound. The negative Moving Average Convergence Divergence (MACD) histogram also indicates that bearish momentum remains in place.
Key levels to monitor include:
- $1.000: Major psychological support.
- $1.160: Initial resistance.
- $1.302–$1.307: 50-day and 100-day EMA resistance.
- $1.360: 200-day EMA resistance.
Conclusion
XRP faces continued downside risks as institutional ETF demand cools, derivatives positioning turns defensive and stronger U.S. employment data support expectations of tighter monetary policy. The $1.00 level is the immediate test for buyers. A sustained break below it could expose the market to a deeper correction, while a move above $1.160 would provide an early indication that selling pressure is easing. Until XRP recovers its key moving averages, the broader technical outlook remains bearish.
Sources & Methodology
Primary-source standard: Market-moving facts should link to original data releases, regulator notices, company filings or official project announcements whenever available. Secondary reporting is used for additional context, not as a substitute for original evidence.
Page last reviewed: