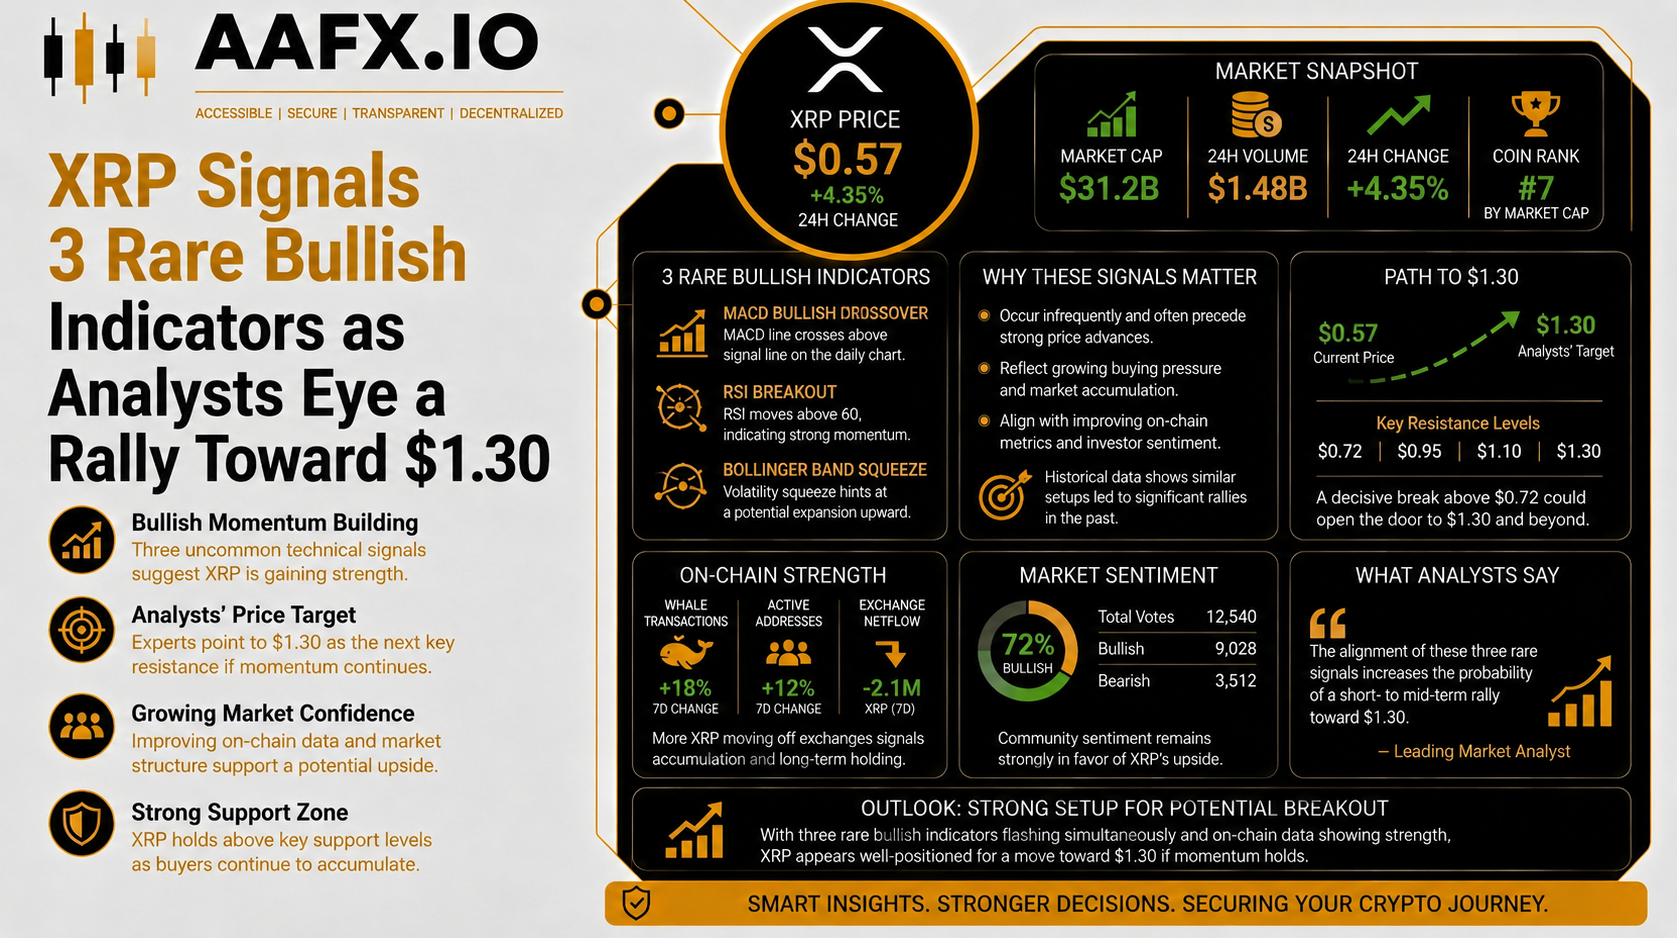
XRP is flashing three rare bullish signals as analysts predict a potential rally toward $1.30. Discover the key technical indicators driving optimism.
XRP Shows Signs of Recovery
XRP may be approaching a critical turning point after enduring weeks of persistent selling pressure. While the digital asset remains well below its recent highs, several technical indicators now suggest bearish momentum is beginning to fade.
Market analysts believe the latest chart formations, combined with historically oversold conditions, could lay the foundation for a broader recovery if key support levels continue to hold.
The token recently stabilized near the $1.02 psychological support level after declining from the $1.20–$1.25 range. Although sellers controlled the market for much of the correction, buying interest has gradually returned, allowing XRP to rebound toward $1.07. Traders are now closely watching whether this recovery can evolve into a sustained upward trend.
Bullish Patterns Strengthen Outlook
Technical analysts have identified multiple signals that typically appear near market bottoms. According to crypto analyst Ali Charts, XRP has formed both a Tom DeMark Sequential Buy Signal and a Morning Star Doji on the daily timeframe.
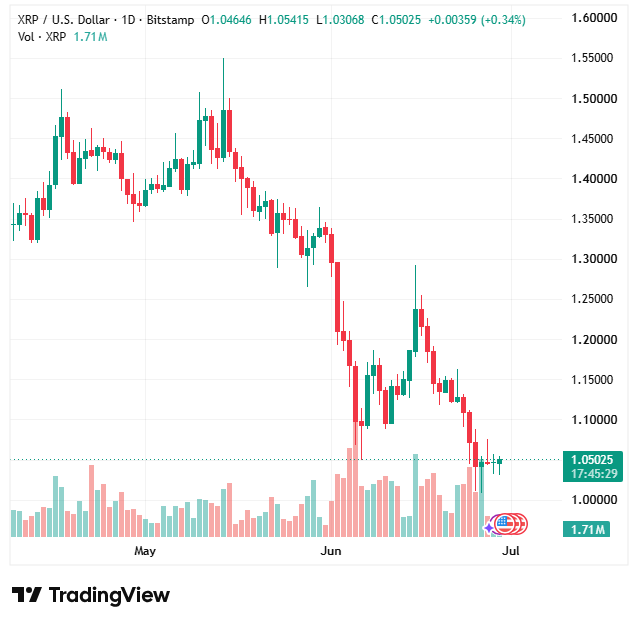
These two indicators rarely appear together and are often interpreted as evidence that selling pressure is weakening while buyers begin regaining control.
For bullish momentum to strengthen, XRP must establish consistent support between $1.07 and $1.10. A successful defense of this range could shift attention toward higher resistance levels.
Key technical levels to watch include:
- Current support: Around $1.02
- Immediate resistance: $1.15
- Major breakout level: $1.21
- Bullish upside target: Approximately $1.30
- Critical confirmation zone: $1.07–$1.10
Higher trading volume alongside these price levels would significantly improve the probability of a sustained recovery.
Rare RSI Signal Draws Attention
Beyond short-term chart patterns, XRP’s long-term technical structure remains constructive. Market analyst CryptoLlica notes that the cryptocurrency continues trading within a rising channel that has remained intact since 2017.
The recent decline has pushed XRP back toward the lower boundary of that channel, an area that has historically acted as a launching point for major advances.
Another factor attracting investor attention is the Relative Strength Index (RSI). The indicator recently dropped to approximately 34, marking one of the lowest readings in XRP’s more than 13-year trading history. Such deeply oversold conditions have been exceptionally rare and have frequently preceded periods of renewed buying interest.
While an oversold RSI does not guarantee an immediate price reversal, it often signals that bearish momentum is losing strength. Combined with improving chart patterns and resilient long-term support, the technical backdrop appears considerably stronger than it did only a few weeks ago.
If buyers continue defending the $1.02 support area while trading volume expands, XRP could challenge $1.15 and $1.21 in the near term. A decisive break above those levels may open the door to a move toward $1.30, confirming that the recent correction has evolved into a meaningful recovery rather than a temporary bounce.