Natural Gas is trading in a narrow technical range, with the supplied five-hour chart placing price near $2.84 between support at $2.815 and resistance around $2.906. The compressed structure leaves the market close to the middle of the range, with neither buyers nor sellers establishing clear control.
The latest market data supports the $2.84 reference. Henry Hub natural gas futures were around $2.84 per million British thermal units (MMBtu) on Sept. 22, while the previous session closed near the same level after a sharp decline. Investing.com data for Micro Henry Hub futures showed a Sept. 21 low of $2.818 before the market stabilized.
Recent price action has also been influenced by changing weather expectations. The Wall Street Journal reported that U.S. natural gas futures fell on Sept. 21 as forecasts pointed toward cooler conditions that could reduce demand, while strong domestic production and lower LNG exports added pressure.
That fundamental backdrop gives the technical range added importance as traders monitor whether demand expectations or supply conditions can push price outside its current boundaries.
$2.815 Support Faces $2.906
The five-hour setup identifies the 200-period simple moving average (SMA) and SuperTrend as a support cluster around $2.815-$2.825. Holding this area would preserve the immediate range structure, while a decisive break could expose lower levels.
Above the market, the short-term moving averages and Ichimoku Cloud create resistance around $2.875-$2.890. The broader ceiling remains near $2.906, where previous attempts to move higher have encountered selling pressure.
The chart’s doji near $2.843 also reflects short-term indecision. At the same time, the MACD reading of approximately -0.0119 versus a signal near -0.006 points to a modest bearish bias, although the gap is not large enough by itself to establish a strong trend.
Key technical levels include:
- Primary support: $2.815-$2.825
- Current price: Around $2.84
- Cloud resistance: $2.875-$2.890
- Major resistance: $2.906-$2.910
- Bearish target: $2.773
The 50% Fibonacci retracement near $2.821 adds another layer of technical significance to the lower boundary.
Breakout Could Define Next Trend
A move below $2.810 would place price beneath the long-term moving-average support identified in the supplied chart. Such a breakdown could open the way toward $2.773, although confirmation through a closing candle and stronger volume would make the signal more significant.
On the upside, a sustained move above $2.906-$2.910 would take price beyond the current range and the nearby resistance cluster. A breakout accompanied by rising turnover would provide stronger evidence that buyers are gaining control.
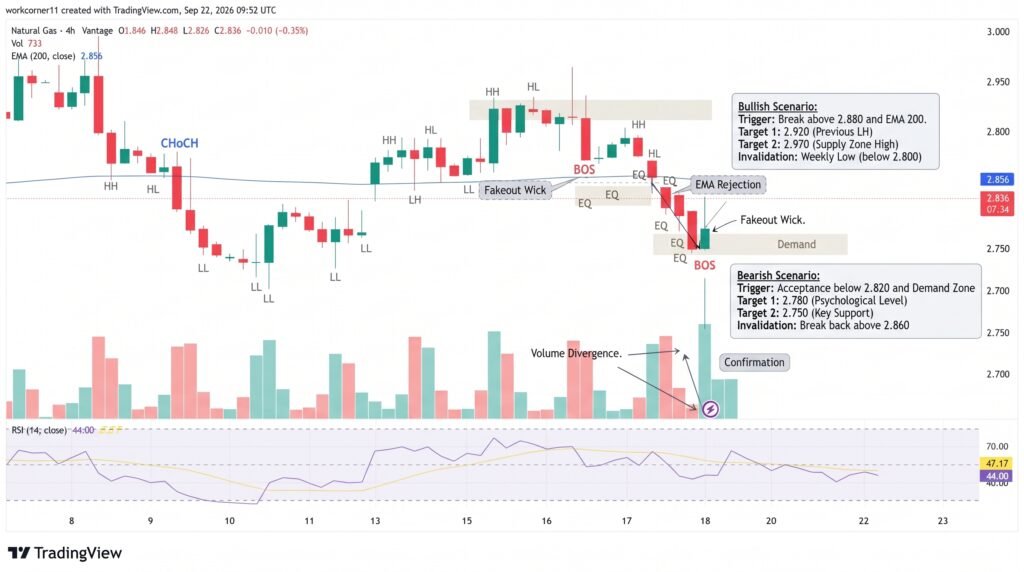
Volume remains an important variable because recent turnover has declined while price has compressed. Historically, lower activity during consolidation can precede a larger move, but volume alone does not establish its direction.
The fundamental picture also warrants attention. The U.S. Energy Information Administration continues to publish weekly storage data that traders use to assess the balance between supply and demand. EIA data show that U.S. underground gas inventories remain a central market indicator as the injection season progresses.
Weather forecasts, domestic production, power-sector consumption and LNG exports can all influence the balance between available gas and demand. Recent market reports have pointed to cooler weather and strong production as near-term pressures, while tighter storage balances can provide support.
Conclusion
Natural gas remains compressed between $2.815 support and $2.906 resistance, with the market near $2.84. The $2.821 Fibonacci level and 200-period SMA reinforce the lower boundary, while the $2.875-$2.910 region contains several layers of resistance. A confirmed break below $2.810 could expose $2.773, while a sustained close above $2.910 would signal an escape from the current range. Volume, weather forecasts and weekly EIA storage data will remain important in determining whether the next move has follow-through.
Sources & Methodology
Primary-source standard: Market-moving facts should link to original data releases, regulator notices, company filings or official project announcements whenever available. Secondary reporting is used for additional context, not as a substitute for original evidence.
Page last reviewed: