Silver is trading around $64.20-$64.30 after a sharp decline, leaving the metal close to a critical support area between $64.00 and $63.50. Recent futures data show silver fell 1.41% on September 24 after touching $63.505, while prices remained near $64.20 in Friday trading.
The broader short-term structure remains under pressure. Silver is trading below its key moving averages, while the SuperTrend indicator sits near $66.60 and continues to signal a bearish bias. The setup leaves $63.50 as an important level for determining whether the current decline extends.
The pressure also reflects the wider precious-metals environment. A stronger US Dollar and higher U.S. Treasury yields have recently weighed on silver and gold as markets reassess the outlook for U.S. interest rates.
- Current silver area: $64.20-$64.30
- Immediate support: $64.00-$63.50
- SuperTrend: Around $66.60
- Key downside reference: $61.17
Bearish Momentum Keeps Pressure High
The technical picture remains tilted lower. Price is below the 20-, 50- and 200-period moving averages, indicating that sellers retain control across several short-term time frames.
The MACD remains negative, while the Relative Strength Index is around 42.3. RSI is moving closer to oversold territory but has not yet reached the conventional 30 threshold. That leaves room for further downside while also allowing for a technical rebound if buyers defend support.
Silver is also trading inside a descending channel, reinforcing the lower-high structure. A doji around $64.29 on September 25 reflects indecision near support, but fading volume does not yet provide strong confirmation of a bullish reversal.
The latest market data show the pressure clearly: silver has fallen from above $68 earlier in the week toward the $64 area, while Friday trading remained close to the lower end of the recent range.
$61.17 Risk Below Key Support
The $64.00-$63.50 area is the immediate battleground. It combines recent price support with the lower Bollinger Bands and the broader Fibonacci structure. A sustained close below $63.50 would weaken the current range and place $61.17 in focus.
The 50% Fibonacci reference around $63.08 provides another nearby technical level, while $58.00 becomes a deeper downside reference if selling accelerates.
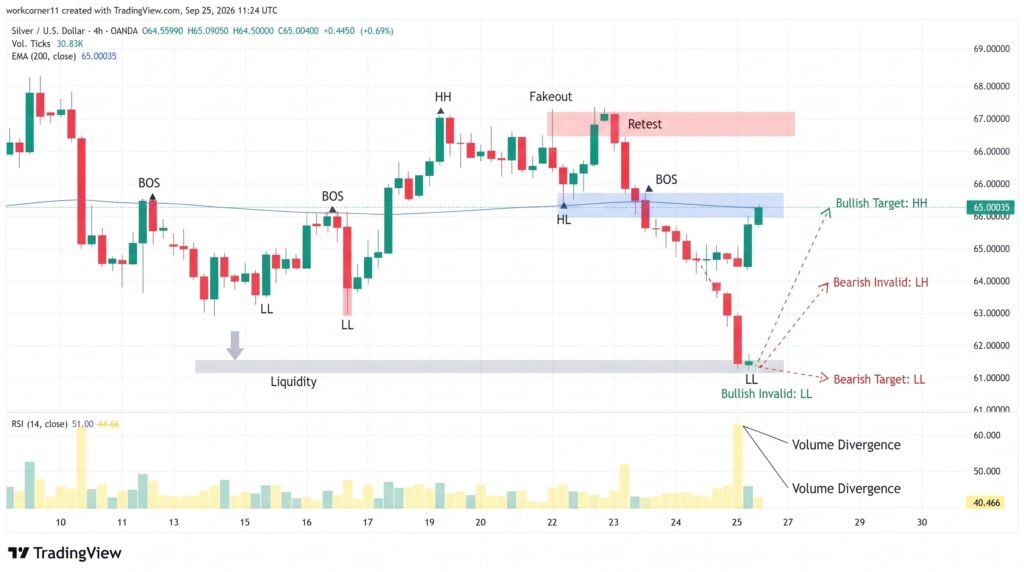
On the upside, silver would first need to recover $65.50 before challenging the $66.60 SuperTrend area. A break above that resistance cluster would reduce the immediate bearish pressure.
- Support: $64.00-$63.50
- Fibonacci reference: $63.08
- Downside target: $61.17
- Resistance: $65.50-$66.60
- Deeper support: $58.00
- ATR: Around $0.87
Conclusion
Silver remains vulnerable near $64.20 as bearish technical signals keep pressure on the market. The $63.50 level is the key near-term test: a confirmed break could expose $61.17 and potentially $58.00, while a successful defense could encourage a rebound toward $65.50-$66.60. With RSI near 42.3 and momentum indicators still negative, the market has not yet established a confirmed reversal. Traders are likely to focus on price action around $63.50 before assessing the next directional move.
Sources & Methodology
Primary-source standard: Market-moving facts should link to original data releases, regulator notices, company filings or official project announcements whenever available. Secondary reporting is used for additional context, not as a substitute for original evidence.
Page last reviewed: