
Brent Oil is trading around $101.32 on the five-hour chart, leaving the benchmark crude price just below a key resistance zone at $102.30. The market is balancing renewed geopolitical supply concerns against signs that some Middle Eastern oil flows are recovering. Brent settled at $102.31 on Thursday after gaining more than 4%, while prices eased on Friday as traders assessed conflicting supply signals.
Brent Oil Faces $102.30 Barrier
The immediate technical focus is the $102.30 area, where several indicators converge. The level sits near the upper boundary of a descending channel and around the SuperTrend, creating a significant test for buyers after Brent’s rebound from the $95 region.
Short-term momentum has improved, with the MACD moving above its signal line. However, the broader chart structure remains constrained by the descending channel. That leaves Brent between improving momentum and an established technical ceiling.
The wider oil market is also highly sensitive to geopolitical developments. Reuters reported that Brent was around $101.61 on Friday after Thursday’s sharp advance, while markets continued to assess U.S.-Iran tensions, Middle Eastern exports and China’s decision to restrict refined-product exports.
$95 Support Remains Critical
The $95-$96 area remains the primary downside zone in the supplied five-hour technical structure. It combines the 200-period SMA, a 38.2% Fibonacci retracement and previous buying activity.
If sellers regain control below $98.86, the 20-period SMA becomes an intermediate reference before the broader $95-$96 support region. A sustained break beneath that zone would weaken the recovery structure and expose lower levels.
The key technical zones are:
- Resistance: $102.00-$103.00
- Immediate support: $98.86
- Major support: $95.00-$96.00
The market’s fundamental backdrop remains unusually sensitive to supply disruptions. The EIA said in its September outlook that Middle Eastern oil production was expected to increase as flows through the strait of hormuz alternative routes and exports gradually recover. At the same time, the agency expected some constraints to persist through the end of 2026.
Breakout or Rejection at $102.30?
A confirmed move above $102.30 would place the upper channel boundary under pressure and could shift attention toward the $103 area. The Bollinger Bands and Ichimoku Cloud also identify the $102-$103 region as an important technical barrier in the supplied setup.
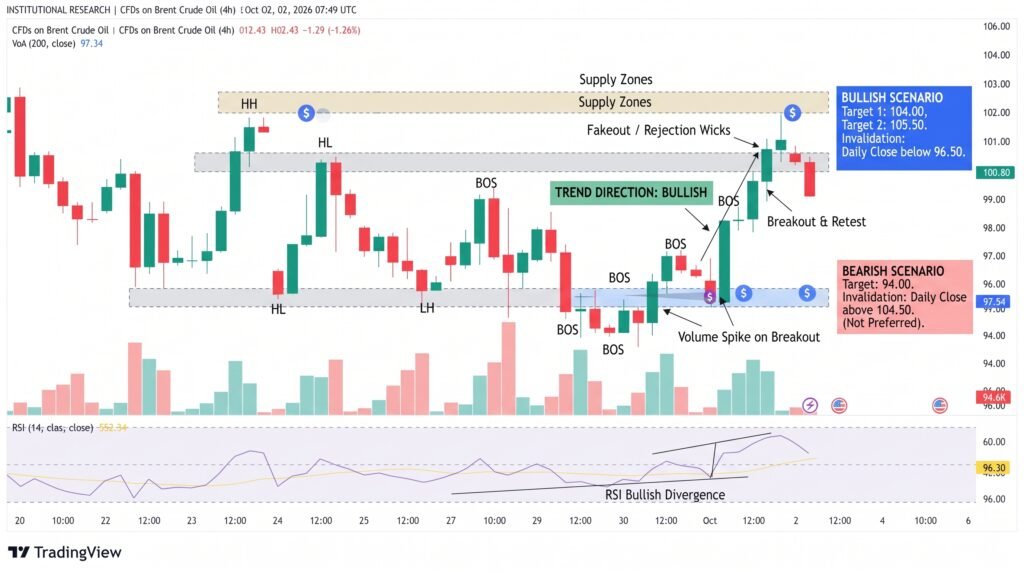
However, failure to clear resistance would leave Brent vulnerable to another pullback. A rejection around $102.30 followed by a break below $98.86 would increase the focus on the $95-$96 demand zone.
Fundamentally, the oil market remains caught between recovering crude flows and continuing risks to refined-product supply. Reuters reported that Saudi exports were recovering, while China’s halt to refined-product exports and renewed U.S. military activity in the Middle East were adding uncertainty.
Conclusion
Brent Oil remains trapped between improving short-term momentum and resistance near $102.30. The $95-$96 region remains the major structural support, while $98.86 is the first level to monitor if sellers return. A sustained break above $102.30 would strengthen the bullish technical structure, while rejection there followed by a move below $98.86 would put the $95 area back in focus. With geopolitical and supply risks still driving crude volatility, price action around these levels remains particularly important.
Sources & Methodology
Primary-source standard: Market-moving facts should link to original data releases, regulator notices, company filings or official project announcements whenever available. Secondary reporting is used for additional context, not as a substitute for original evidence.
Page last reviewed: