
Pi Network (PI) extended its losses on Monday, November 9, falling more than 5% after a 6% decline in the previous session. The token traded near $0.0656, marking a fresh record low in the market snapshot. At the same time, futures open interest dropped 23% in a week, indicating that traders were rapidly reducing their exposure. Despite deeply oversold technical conditions, selling momentum remains dominant, leaving $0.0516 as the next major downside level to watch.
PI Open Interest Falls 23% in a Week
Investor participation in Pi Network derivatives has weakened alongside the token’s price. Blockworks data showed PI futures open interest falling to $6.57 million, down from $8.54 million a week earlier. The reduction represents a 23% decline in the notional value of outstanding positions.
Open interest measures the value of futures contracts that remain active. When both an asset’s price and open interest decline, it can indicate that traders are closing positions and reducing market exposure. The latest contraction therefore points to weaker participation in PI derivatives rather than an increase in new bullish positions.
Broader uncertainty following the U.S. midterm elections has also weighed on cryptocurrency sentiment. Smaller digital assets can face greater selling pressure when investors move away from speculative positions and prioritize liquidity.
However, falling open interest does not automatically confirm forced liquidations. It can also reflect voluntary position closures. The combination of declining prices and reduced futures exposure nevertheless highlights the difficulty PI faces in attracting fresh buying interest.
PI Technical Analysis Points to $0.0516
PI traded around $0.0656, below its previous swing low of $0.0704 recorded on July 14. That breakdown has weakened the technical structure, turning the former support area into a potential resistance zone. A descending trendline near $0.0757 presents another barrier to recovery.
The token also remains significantly below its 50-day exponential moving average (EMA) at $0.0803 and its 200-day EMA at $0.1101. Both averages indicate that the broader trend remains under pressure.
The daily Relative Strength Index (RSI) stands near 18, well below the commonly used oversold threshold of 30. This suggests that selling has become extended, although an oversold reading does not guarantee an immediate rebound. The Moving Average Convergence Divergence (MACD) line has also moved below its signal line in negative territory, reinforcing the bearish momentum.
Key PI Support and Resistance Levels
Fibonacci extension analysis based on the decline from $0.1394 to $0.0704 identifies further downside areas if selling continues.
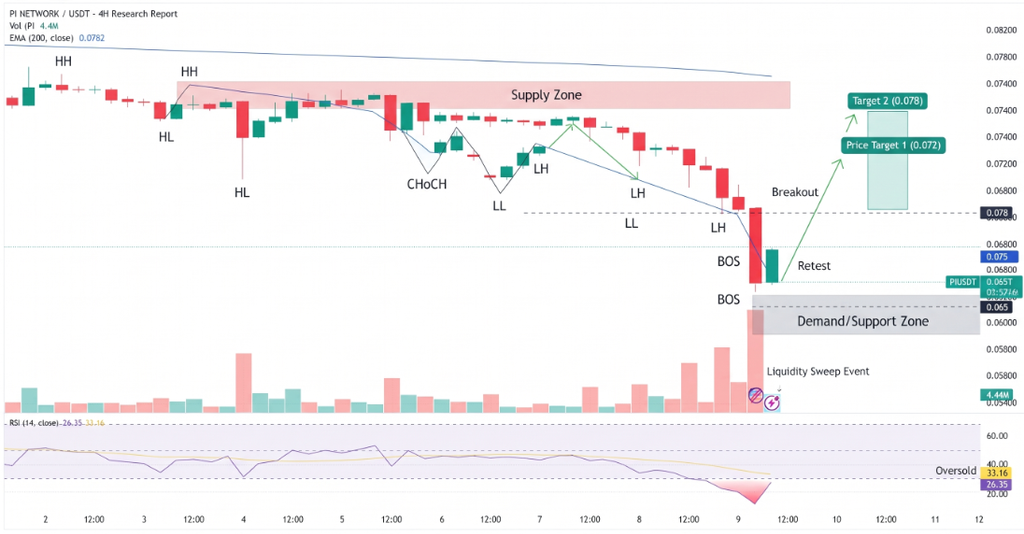
Traders are watching these levels:
- $0.0516: 127.2% Fibonacci extension and first projected support.
- $0.0277: 161.8% extension and deeper downside target.
- $0.0704: Former swing low and initial resistance.
- $0.0757: Descending trendline resistance.
- $0.0803: 50-day EMA resistance.
Conclusion
Pi Network remains exposed to further losses as falling open interest signals reduced derivatives participation and technical indicators continue to favor sellers. The RSI reading near 18 leaves room for a short-term relief rebound, but it does not establish that a durable bottom has formed. A recovery above $0.0704 and $0.0757 would be needed to improve the near-term outlook. Until those levels are reclaimed, $0.0516 remains the key downside target, with $0.0277 representing a deeper Fibonacci projection if selling pressure intensifies.
Sources & Methodology
Primary-source standard: Market-moving facts should link to original data releases, regulator notices, company filings or official project announcements whenever available. Secondary reporting is used for additional context, not as a substitute for original evidence.
Page last reviewed: