
Injective (INJ) extended its decline on Thursday, slipping below $7.50 after losing approximately 6% in the previous session. Weakening derivatives activity and a persistent sell-side bias are adding pressure, while the token approaches an important rising support trendline. Open Interest has retreated from its October peak, suggesting traders are reducing their exposure as momentum deteriorates. Although INJ remains above its longer-term moving average, a break below nearby support could expose the token to a deeper correction.
INJ derivatives show growing selling pressure
Data from CoinGlass shows Injective futures Open Interest (OI) falling to 18.61 million INJ, down from 23.52 million INJ on October 17. Open Interest measures the total number of outstanding derivatives contracts and helps indicate how much capital remains committed to the futures market.
The decline suggests traders have reduced their positions, although falling OI alone does not establish whether investors are closing bullish or bearish trades. Combined with the weak taker buy-to-sell ratio, however, the latest readings point to subdued demand.
The ratio stood at 0.96, below the neutral threshold of 1. A reading under 1 indicates that market participants are executing more aggressive sell orders than buy orders. The data also showed sellers accounting for 51.1% of taker activity, reinforcing the near-term negative tone.
These figures suggest that buyers are struggling to absorb selling pressure. If derivatives participation continues to contract while aggressive selling persists, INJ could face difficulty sustaining a recovery.
Injective price forecast: Trendline in focus
INJ traded around $7.48 in the supplied Thursday market snapshot, below its 50-day Exponential Moving Average (EMA) near $7.56. The 50-day EMA tracks the average price over the recent trading period, giving greater weight to newer prices. Trading beneath it signals that short-term momentum has weakened.
The token remains above a reclaimed rising trendline around $7.1868, which represents the first important support area. Its 200-day EMA near $6.2712 continues to provide a longer-term reference point, suggesting the broader price structure has not completely deteriorated.
Momentum indicators nevertheless show signs of strain. The Moving Average Convergence Divergence (MACD) has crossed below its signal line, a development that can indicate weakening bullish momentum. Meanwhile, the Relative Strength Index (RSI) sits near 46, below the neutral 50 mark but not yet in conventional oversold territory.
Key INJ support and resistance levels
The next directional move may depend on whether buyers can defend the rising trendline. A sustained daily close below it would weaken the technical structure and shift attention toward lower support levels.
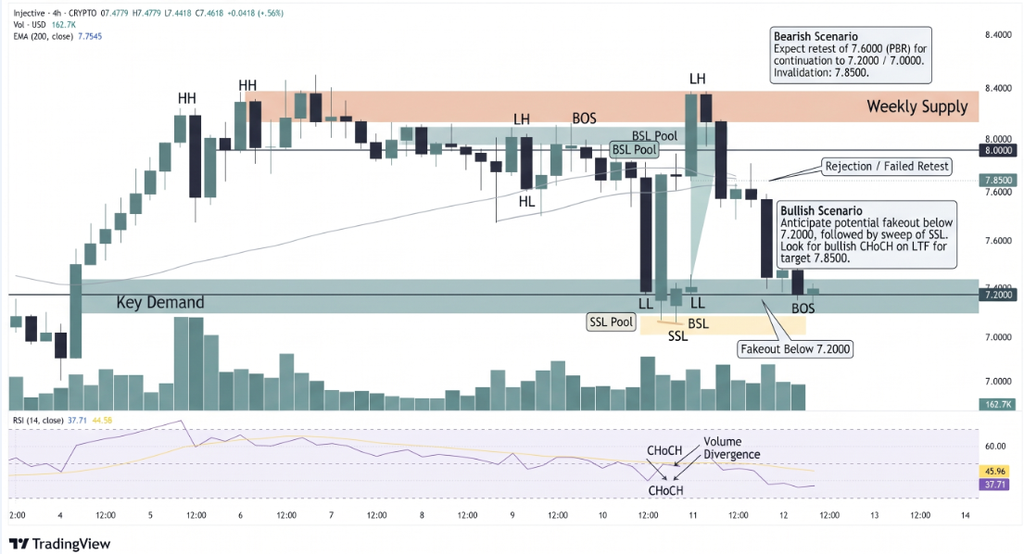
Important price levels from the supplied chart analysis include:
- First support: $7.1868 trendline.
- Next support: $6.7140 horizontal floor.
- Longer-term support: $6.2712 at the 200-day EMA.
- Immediate resistance: $7.55–$7.56 around the 50-day EMA.
- Major resistance: $8.3490, followed by $9.4130.
A daily close above $8.3490 would improve the recovery outlook and potentially open the way toward $9.4130. Until then, rallies may encounter selling interest near the moving average.
Conclusion
Injective faces mounting downside risk as derivatives activity contracts and sell orders outweigh aggressive buying. The $7.1868 trendline is the immediate level to watch. Holding above it could preserve the possibility of consolidation and recovery, while a decisive break would expose $6.7140 and the 200-day EMA near $6.2712. A stronger bullish signal would require INJ to reclaim its 50-day EMA and overcome $8.3490.
Sources & Methodology
Primary-source standard: Market-moving facts should link to original data releases, regulator notices, company filings or official project announcements whenever available. Secondary reporting is used for additional context, not as a substitute for original evidence.
Page last reviewed: