USD/CAD traded near 1.4260 on Friday, extending its advance for a fourth consecutive session while approaching the lower boundary of a rising wedge pattern around 1.4250. Although the pair remains supported by its short- and medium-term moving averages, the chart formation raises the risk of a bearish reversal if buyers fail to defend the pattern. Meanwhile, the Bank of Canada’s cautious approach to monetary policy could limit expectations of a rapid narrowing in the interest-rate gap with the United States.
Rising wedge puts USD/CAD bulls on alert
The daily chart shows USD/CAD trading within a rising wedge, a technical formation characterised by upward-sloping support and resistance lines that gradually converge. The pattern can precede a bearish breakout, particularly when prices fall through the lower trendline. However, the formation is not confirmed as bearish until support gives way.
The pair remains above its nine-day and 50-day exponential moving averages (EMAs), located at 1.4165 and 1.4081, respectively. This positioning indicates that the near-term trend still favours buyers despite the developing reversal risk.
The 14-day Relative Strength Index (RSI) stands at 67.2, approaching but remaining below the conventional overbought threshold of 70. The reading suggests strong upward momentum, although the advance may be becoming stretched.
The immediate technical levels are:
- Initial support: Rising wedge boundary near 1.4250.
- Moving-average support: Nine-day EMA at 1.4165 and 50-day EMA at 1.4081.
- Immediate resistance: Previous high at 1.4299.
- Further resistance: Upper wedge boundary near 1.4330.
A sustained break below 1.4250 could strengthen the bearish case. A deeper decline beneath both moving averages would expose the 1.3732 region, identified as the five-month low in the supplied chart analysis.
BoC policy outlook limits Canadian dollar support
The monetary-policy outlook remains an important influence on the Canadian dollar. Analysts at NBC expect the Bank of Canada to proceed cautiously because underlying inflation has remained relatively contained, despite pressure from energy costs.
That approach could delay a meaningful narrowing of the policy gap between the BoC and the Federal Reserve. If US interest rates remain relatively higher, dollar-denominated assets may retain a yield advantage, potentially supporting USD/CAD.
However, the relationship is not one-directional. Changes in crude oil prices also matter because Canada is a major energy exporter. Higher oil prices can support the Canadian dollar by improving the country’s export outlook, while weaker energy markets can remove some of that support.
The NBC commentary supplied with the source refers to policy convergence as a development for 2025. Given the article’s apparent later timeframe, that forecast reference should be treated as outdated unless the original research confirms a different year.
USD/CAD forecast: 1.4250 is key
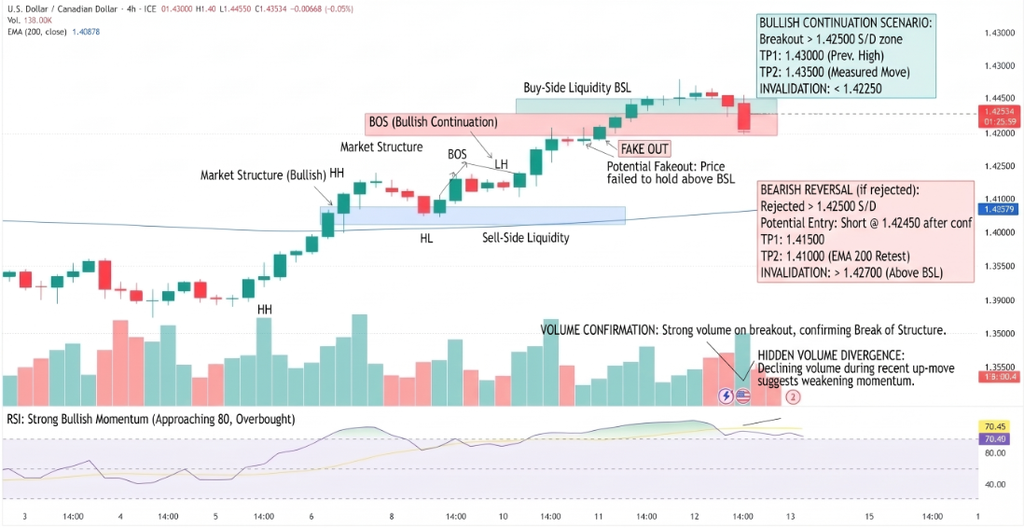
The immediate direction depends on whether buyers can defend the rising wedge’s lower boundary. Holding above 1.4250 would leave the pair positioned to challenge 1.4299 and potentially 1.4330. A decisive breakdown, by contrast, would shift attention towards the nine-day EMA at 1.4165 and the 50-day EMA at 1.4081.
Conclusion
USD/CAD retains a positive near-term bias, but the rising wedge and RSI near 70 suggest that upward momentum is becoming vulnerable. A break below 1.4250 would provide an early warning of a possible reversal, while a move above 1.4330 would weaken the immediate bearish pattern.
Sources & Methodology
Primary-source standard: Market-moving facts should link to original data releases, regulator notices, company filings or official project announcements whenever available. Secondary reporting is used for additional context, not as a substitute for original evidence.
Page last reviewed: