
Ethereum traded near $2,400 on Monday as persistent selling pressure limited its recovery, despite continued accumulation by BitMine Immersion Technologies. The company’s latest purchase of 12,535 ETH lifted its holdings above 6.04 million tokens, highlighting a contrast between corporate treasury demand and weakening institutional investment flows. U.S. spot Ethereum exchange-traded funds (ETFs) recorded approximately $320 million in weekly net outflows, while technical indicators showed resistance above the market and nearby support around $2,355. The balance between accumulation, fund withdrawals and key price levels will shape Ethereum’s near-term outlook.
BitMine Expands Its ETH Holdings
BitMine Immersion Technologies purchased 12,535 Ether during the week ending October 18, extending its buying streak since the launch of its Ethereum treasury strategy on June 30, 2025. The company reported holdings of 6,041,481 ETH, representing approximately 4.9% of the total supply of 122.1 million tokens.
At the company’s reported valuation of $2,365 per ETH on October 18, its Ethereum holdings were worth approximately $14.3 billion. BitMine’s broader portfolio of cryptocurrency, cash, marketable securities and other investments totaled $15.1 billion.
The company is pursuing its stated goal of owning 5% of the ETH supply, a strategy Chairman Thomas Lee calls the “Alchemy of 5%.”
Lee attributed recent weakness across digital assets partly to reduced investor risk appetite, rising global bond yields, concerns about artificial-intelligence spending and geopolitical uncertainty. He argued that price declines could create opportunities when underlying fundamentals remain strong.
However, corporate buying has not eliminated broader market pressure. Investors continue to weigh whether treasury accumulation can offset weaker demand elsewhere.
ETF Outflows Pressure Ethereum Demand
U.S. spot Ethereum ETFs recorded approximately $320 million in net withdrawals between October 12 and October 16, according to SoSoValue data. This marked a third consecutive week of outflows, signaling continued caution among investors using regulated funds to gain exposure to Ether.
BlackRock’s iShares Ethereum Trust accounted for approximately $299 million of the weekly withdrawals, representing most of the net decline. The outflows suggest that BitMine’s accumulation is occurring alongside substantial selling pressure from another segment of the market.
Ethereum derivatives also reflected heightened volatility. Futures liquidations reached approximately $87 million over 24 hours, including more than $71 million in short liquidations. Liquidations occur when exchanges forcibly close leveraged positions after traders can no longer meet margin requirements.
Key market signals include:
- Treasury accumulation: BitMine added 12,535 ETH.
- ETF flows: Weekly net outflows reached $320 million.
- Derivatives: About $87 million in futures positions were liquidated.
- Market structure: ETH remained below its 20-day and 50-day exponential moving averages.
Ethereum Price Forecast and Key Levels
Ethereum’s daily chart retained a bearish near-term bias as the price traded below the 50-day exponential moving average (EMA) near $2,483 and the 20-day EMA around $2,504. These indicators track average prices while giving greater weight to recent trading, helping traders identify potential trends and resistance zones.
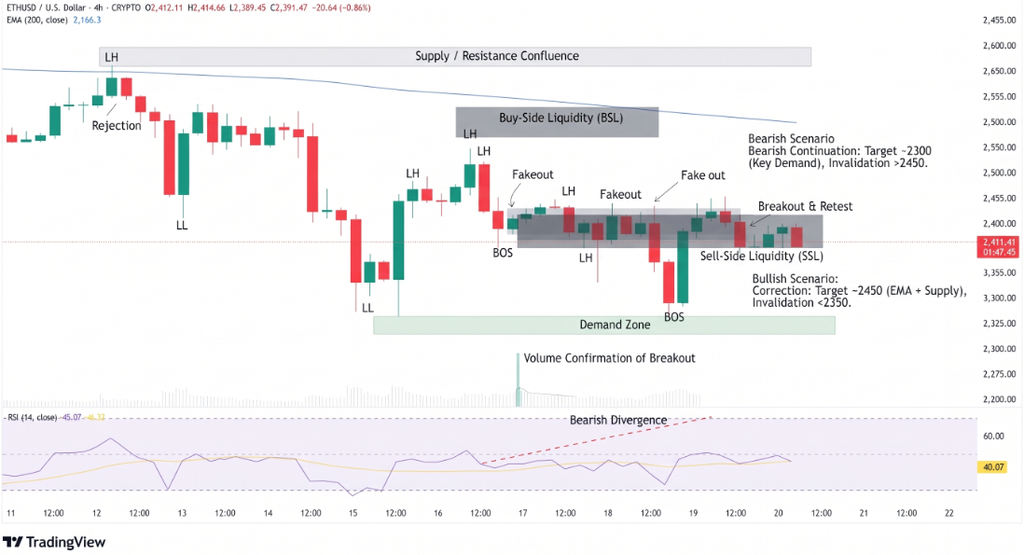
The 100-day EMA near $2,351 aligns with horizontal support around $2,355. The Relative Strength Index (RSI) in the high-30s and the Stochastic indicator near the low-20s point to weak momentum, although these readings alone do not confirm a reversal.
A sustained move above $2,504 could improve the technical picture and bring resistance at $2,548, $2,637 and $2,782 into focus. Conversely, a break below $2,351–$2,355 could expose support at $2,205, followed by $1,972 and $1,828.
Conclusion
Ethereum’s recovery depends on whether buyers can defend support while overcoming persistent ETF outflows and overhead resistance. BitMine’s continued accumulation provides evidence of corporate demand, but it does not guarantee a price rebound. A sustained break above $2,504 would strengthen the recovery case, while a loss of the $2,351 support area would increase downside risks. Traders should monitor ETF flows, trading volume and momentum indicators before drawing conclusions about a durable trend reversal.
Sources & Methodology
Primary-source standard: Market-moving facts should link to original data releases, regulator notices, company filings or official project announcements whenever available. Secondary reporting is used for additional context, not as a substitute for original evidence.
Page last reviewed: