
Solana (SOL) extended its decline on Friday, falling below $90 to a two-month low after losing more than 6% in the previous session. Weak cryptocurrency sentiment, declining futures positioning and renewed institutional withdrawals have increased pressure on the digital asset. Solana-focused exchange-traded funds (ETFs) recorded $1.18 million in outflows on Thursday, while futures Open Interest dropped to 59.45 million SOL. With the broader market facing more than $1 billion in liquidations, traders are watching the critical $87.21 support level, whose breakdown could expose SOL to a deeper correction toward $70.58.
Solana ETF Outflows Weaken Investor Demand
Solana’s decline reflects weakening participation from both institutional and retail investors as uncertainty across financial markets encourages reduced exposure to risk-sensitive assets.
According to SoSoValue, Solana-focused ETFs registered $1.18 million in net outflows on Thursday, ending three consecutive sessions without reported flows. The withdrawals followed a difficult previous week, when investment products tracking SOL experienced $71.47 million in outflows, their largest weekly withdrawal and fourth consecutive week of net redemptions.
The continued withdrawals suggest that institutional investors remain cautious about increasing exposure to Solana during the current market downturn.
Retail positioning also indicates declining confidence. CoinGlass data shows that Solana futures Open Interest (OI) decreased to 59.45 million SOL from 62.71 million on Monday. Open Interest measures the total number of outstanding derivatives contracts and helps assess whether traders are increasing or reducing market exposure.
Thursday’s liquidation figures added to the negative outlook. Total SOL liquidations reached $42.87 million, including $39.37 million in long positions. This means traders betting on higher prices accounted for the majority of forced position closures.
The developments highlight several sources of selling pressure:
- ETF outflows: $1.18 million withdrawn on Thursday.
- Weekly institutional withdrawals: $71.47 million during the previous week.
- Open Interest: Declined from 62.71 million to 59.45 million SOL.
- Long liquidations: Reached $39.37 million on Thursday.
SOL Price Forecast: $87 Support at Risk
SOL traded around $89.65 on Friday, extending its sixth consecutive weekly decline. The cryptocurrency remains below its 200-day Exponential Moving Average (EMA) at $99.62, indicating that its broader price structure remains under pressure.
The 50-day EMA has also declined to $101.92. Its potential crossover below the 200-day EMA could form a bearish pattern known as a Death Cross, often interpreted as a warning of weakening medium-term momentum.
More immediately, Solana is testing a long-term ascending support trendline near $89.83, connecting the June 6 and June 25 lows.
A decisive break below this trendline could expose the horizontal support at $87.21. If sellers push SOL beneath that level, the next significant downside objective stands near $70.58, last tested on August 1.
Technical Indicators Signal Bearish Momentum
Daily momentum indicators reinforce the cautious outlook. The Relative Strength Index (RSI) stands near 29, placing SOL in oversold territory. This suggests substantial selling pressure, although oversold conditions alone do not guarantee an immediate rebound.
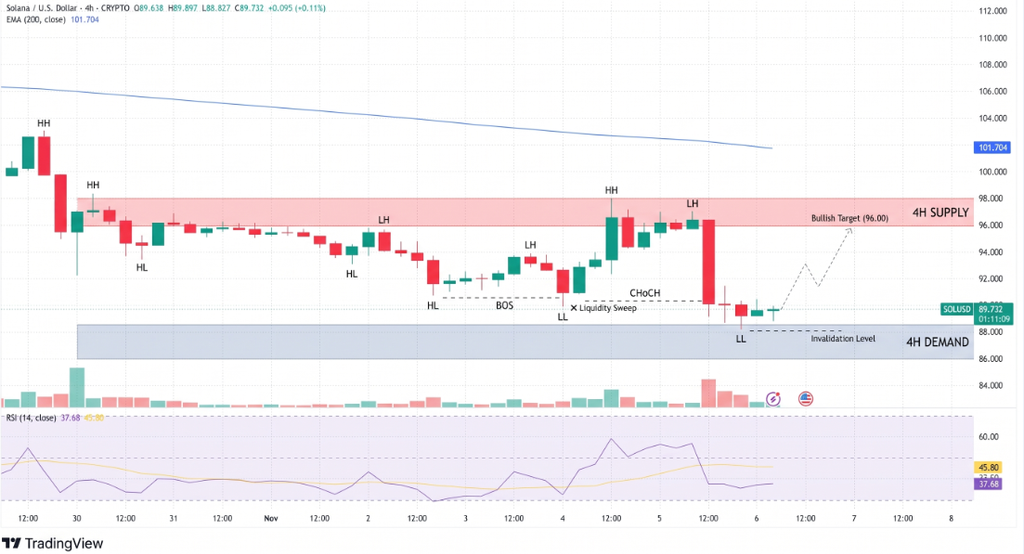
Meanwhile, the Moving Average Convergence Divergence (MACD) remains below its signal line and in negative territory, indicating that bearish momentum continues to dominate.
On the upside, a recovery above the immediate trendline could allow SOL to challenge resistance at the major moving averages:
- $99.62: 200-day EMA resistance.
- $101.92: 50-day EMA resistance.
- $87.21: Critical horizontal support.
- $70.58: Potential downside target.
Conclusion
Solana faces increasing downside risks as institutional withdrawals, declining derivatives exposure and heavy long liquidations weaken demand. The $87.21 level is the immediate technical threshold. A confirmed breakdown could accelerate losses toward $70.58, while a recovery above $99.62 would provide the first meaningful indication that selling pressure is easing.
Sources & Methodology
Primary-source standard: Market-moving facts should link to original data releases, regulator notices, company filings or official project announcements whenever available. Secondary reporting is used for additional context, not as a substitute for original evidence.
Page last reviewed: