
The US Dollar Index (DXY) fell more than 0.5% on Thursday, extending its retreat from a recent high near 103.00 as falling US Treasury yields weakened demand for the US currency. The pullback came despite hotter-than-expected September inflation, which had initially revived expectations of tighter monetary policy. Investors are balancing the Federal Reserve’s near-term rate outlook against persistent energy-price risks and geopolitical uncertainty. Technically, DXY is testing the 23.6% Fibonacci retracement at 101.92, a level that could determine whether the decline deepens or the broader uptrend resumes.
Treasury Yields Pressure the US Dollar
The dollar’s retreat followed a sharp reversal in the US government bond market. The benchmark 10-year Treasury yield fell toward 5.09%, its lowest level in approximately three weeks, after climbing following Wednesday’s inflation report. Reports about possible indirect Chinese purchases of US government bonds also drew market attention, although the impact of that reported development remains uncertain.
The US Bureau of Labor Statistics reported that headline Consumer Price Index (CPI) inflation rose 0.6% month over month in September and 3.7% annually, compared with 3.4% in August. Core CPI, which excludes food and energy, increased 2.6% year over year, while gasoline prices jumped 9.1% during the month.
Despite the inflation surprise, traders continued to assess whether the Federal Reserve would leave interest rates unchanged at its October 27–28 meeting. Cautious remarks from Fed officials helped temper expectations for an immediate increase, even as elevated oil prices kept the prospect of further tightening in view.
Geopolitical risks, including tensions in the Middle East and concerns surrounding the Strait of Hormuz, could still support the dollar’s traditional safe-haven appeal if market uncertainty intensifies.
DXY Tests Fibonacci Support at 101.92
On the four-hour chart, the dollar index remains above its 100-period simple moving average (SMA), preserving a cautiously bullish technical structure. However, momentum has weakened as the index trades just above the 23.6% Fibonacci retracement at 101.92.
The Relative Strength Index (RSI) is near 44, below the neutral 50 threshold, while the Moving Average Convergence Divergence (MACD) indicator is moving lower in negative territory. Together, these readings suggest that sellers have gained short-term influence, although they do not independently confirm a sustained bearish reversal.
The next move depends on whether DXY can defend its immediate support or regain upward momentum.
Dollar Index Forecast: Levels to Watch
Traders are monitoring several technical thresholds for confirmation of the next directional move:
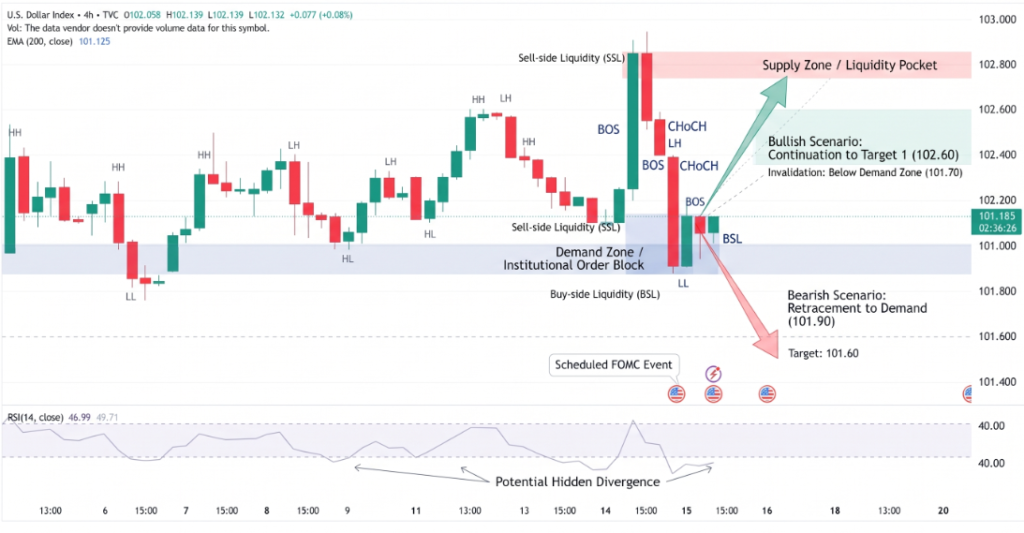
- 101.92 support: A break below the 23.6% Fibonacci level would expose the 100-period SMA near 101.79.
- 101.28–100.77 zone: A deeper correction could bring this broader Fibonacci support cluster into focus.
- 102.95 resistance: A sustained break above the recent cycle high would strengthen the bullish outlook and potentially extend the advance.
Conclusion:
DXY’s retreat below 102.00 reflects falling Treasury yields and uncertainty over the Fed’s next decision, despite persistent inflation pressures. Holding 101.92 would help preserve the broader bullish structure, while a decisive break could extend losses toward 101.79 and the 101.28–100.77 support zone. A move above 102.95 would put buyers back in control.
Sources & Methodology
Primary-source standard: Market-moving facts should link to original data releases, regulator notices, company filings or official project announcements whenever available. Secondary reporting is used for additional context, not as a substitute for original evidence.
Page last reviewed: