Quick Answer
Bollinger Bands are volatility-adjusted price envelopes built around a moving average. The standard setup uses a 20-period Simple Moving Average as the middle band, with an upper and lower band placed two standard deviations above and below it. When recent volatility rises, the bands usually widen; when volatility falls, they contract. Traders use Bollinger Bands to judge whether price is relatively high or low, identify volatility squeezes, study trend strength, and structure mean-reversion or breakout rules. A touch of the upper band is not automatically a sell signal, and a touch of the lower band is not automatically a buy signal. Market regime, price confirmation and risk management matter.
What Are Bollinger Bands?
Bollinger Bands are a technical-analysis tool created by John Bollinger in the early 1980s. They were designed as adaptive trading bands that respond to changing volatility rather than using a fixed percentage distance above and below price. The indicator can be applied to forex, stocks, commodities, futures and other liquid markets across many timeframes.
The indicator answers a simple question: is price relatively high or low compared with its recent distribution? The upper band represents a relatively high price area and the lower band a relatively low area. That information becomes useful only when combined with the trend, volatility regime, market structure and a clearly defined trading rule.
In my chart work, I pay as much attention to the shape of the bands as to the position of price. Narrowing bands tell me volatility is compressing. Rapid expansion tells me the market regime has changed. If price repeatedly pushes along an outer band while the middle average slopes in the same direction, I treat that very differently from a one-off band touch inside a flat range.
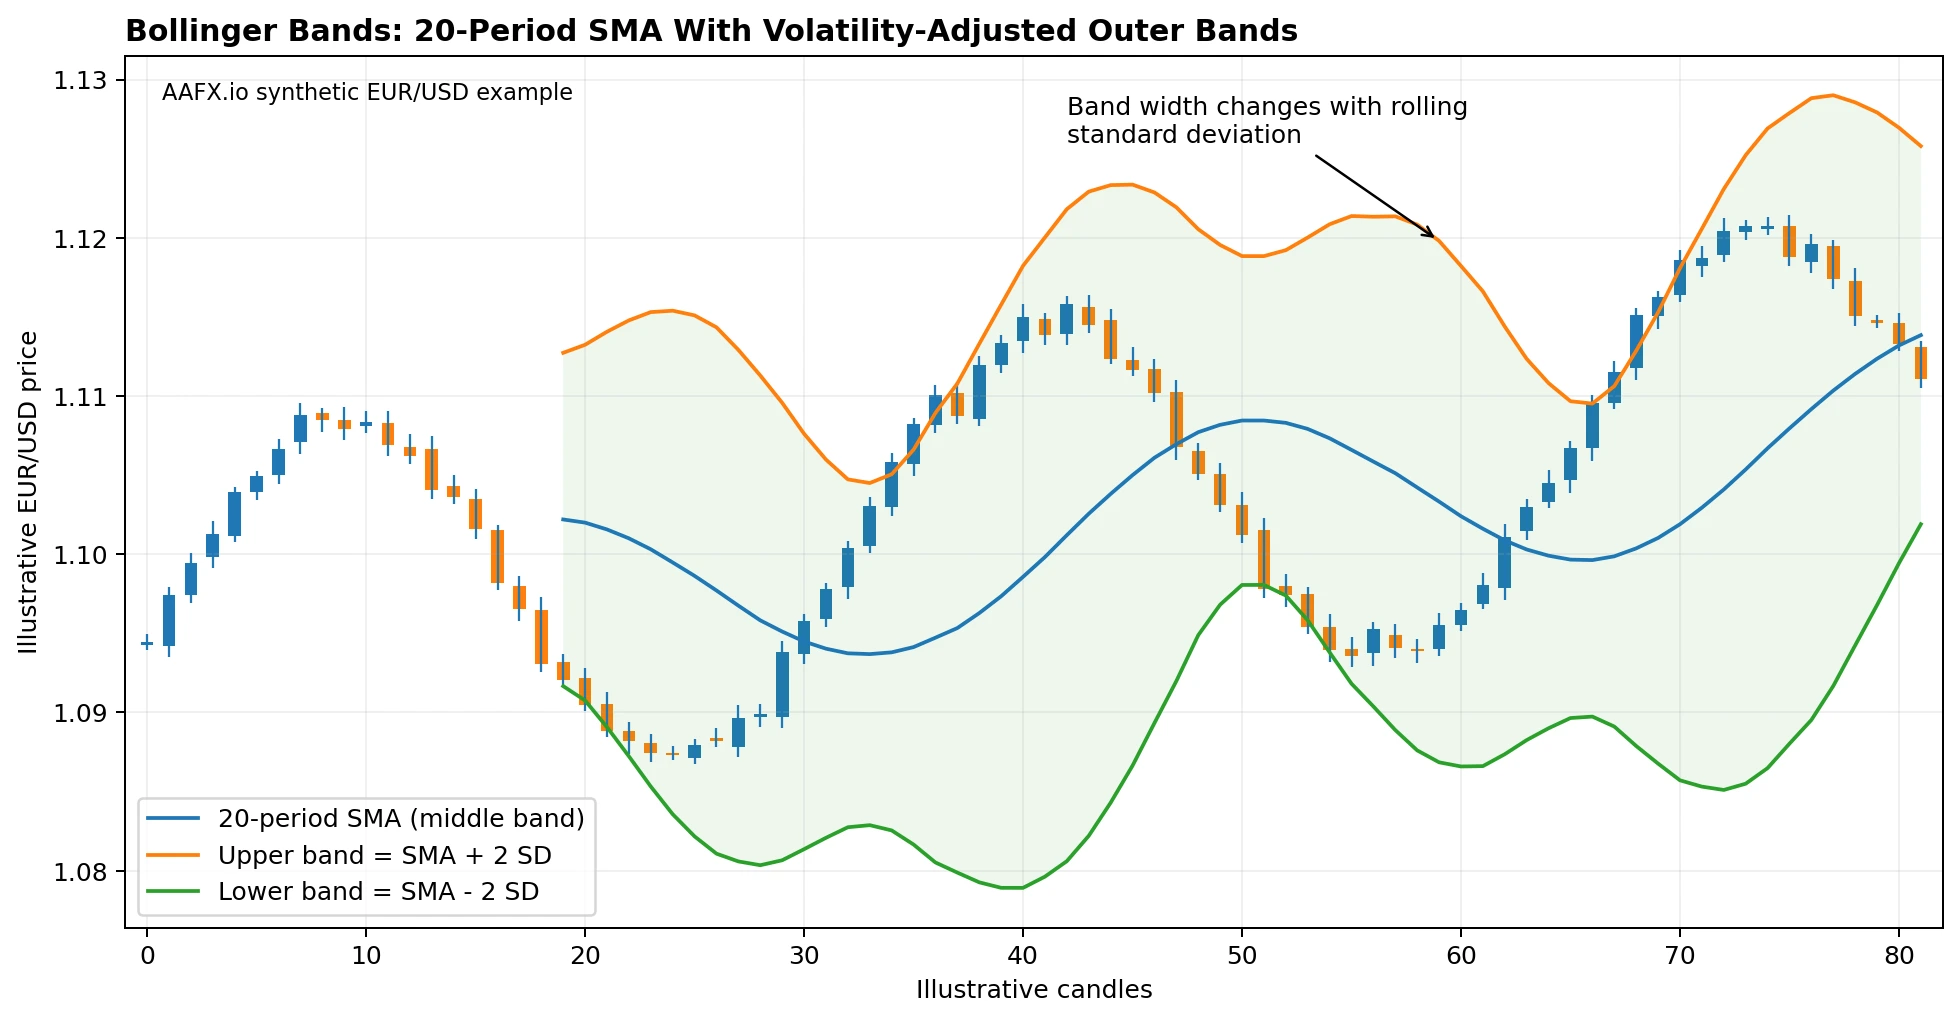
The classic Bollinger Bands structure uses a moving average in the middle and volatility-adjusted upper and lower bands. The default 20-period, 2-standard-deviation setup is common, but it is not a universal trading rule.
How Bollinger Bands Are Calculated
The standard formulation uses the same lookback period for the middle moving average and the rolling standard-deviation calculation.
Middle Band = N-period Simple Moving Average
Upper Band = Middle Band + (K x Standard Deviation)
Lower Band = Middle Band – (K x Standard Deviation)
The traditional default is N = 20 and K = 2. John Bollinger specifies a population standard-deviation calculation using the same data as the moving average. Most charting platforms handle this automatically. If a platform uses a different standard-deviation convention, applied price or moving-average type, the plotted bands may differ slightly.
Standard deviation measures how dispersed recent prices are around their average. The bands therefore widen when recent dispersion increases and narrow when it falls. They do not widen because price is rising and contract because price is falling. A quiet uptrend can have relatively narrow bands, while a sharp selloff can create rapid band expansion.
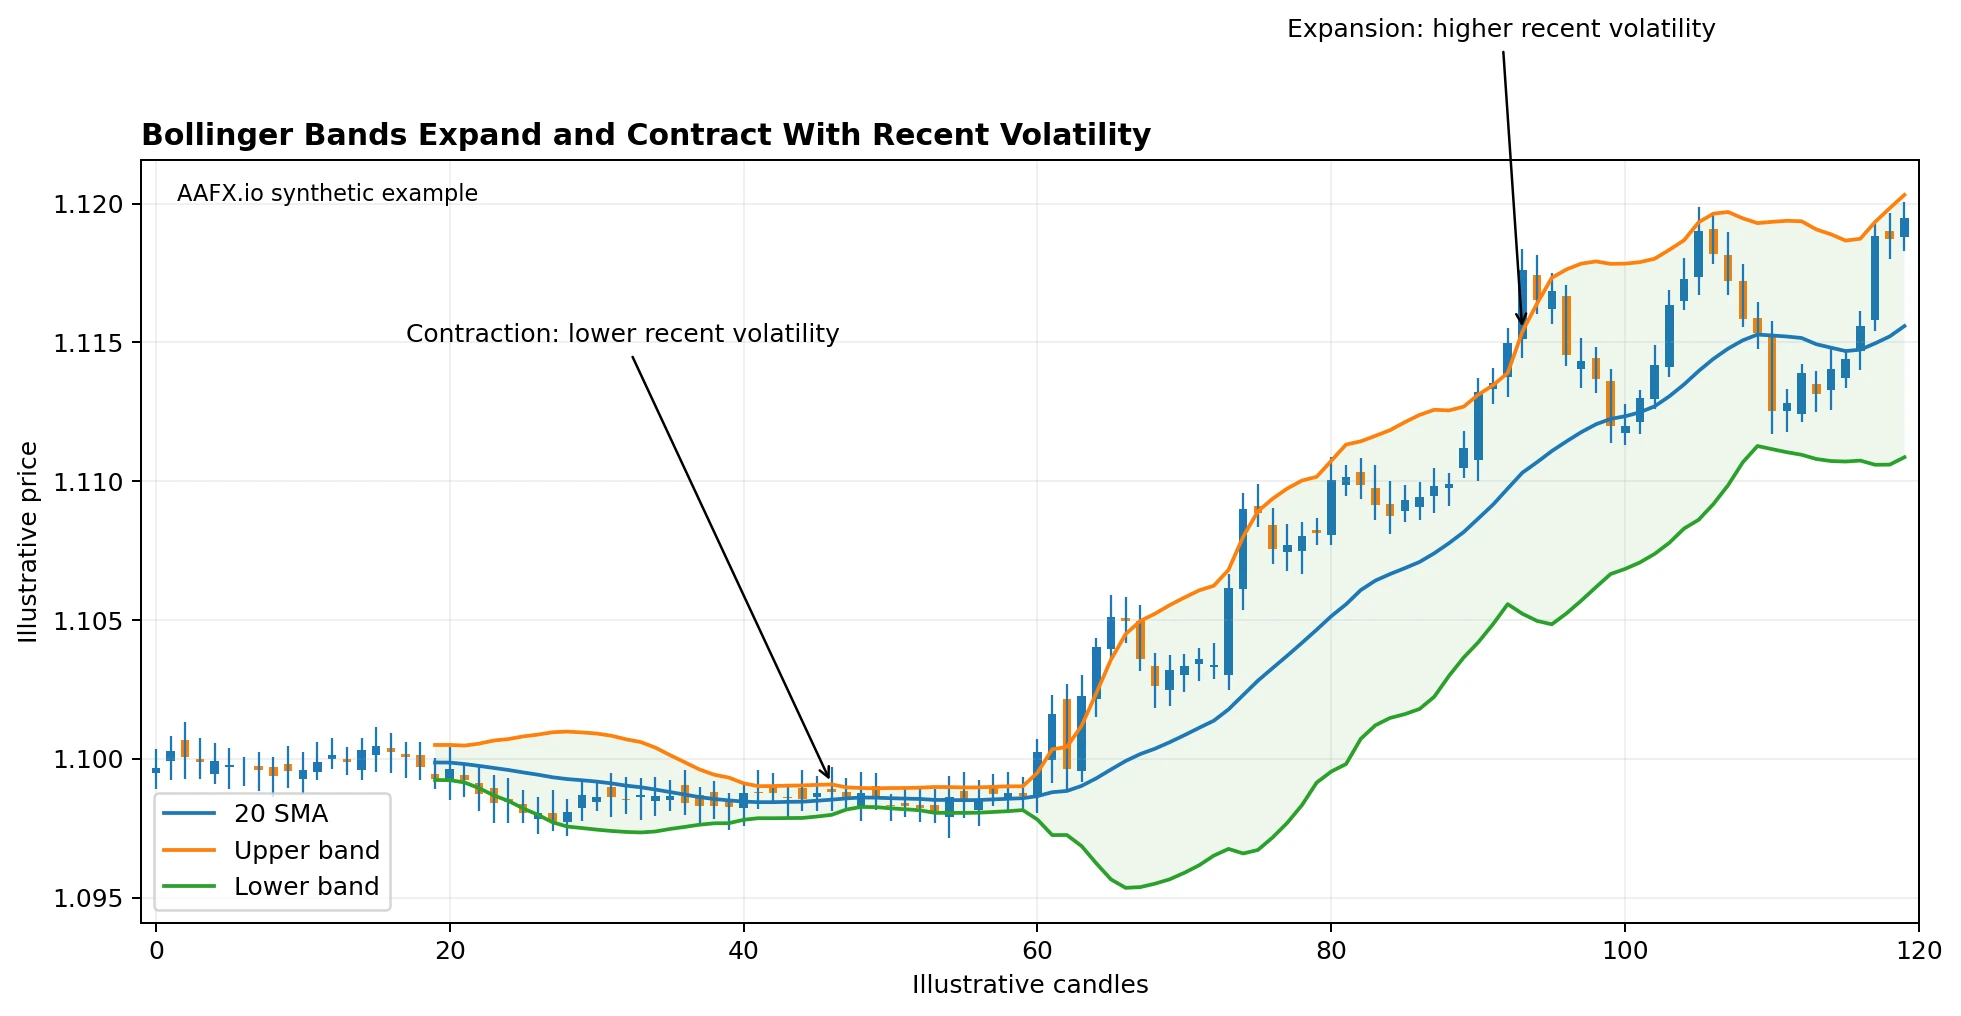
Band distance is driven by recent volatility, not price direction. Both rallies and selloffs can widen the bands when price dispersion increases.
Understanding the Three Bollinger Bands
| Component | What it represents | How to interpret it |
|---|---|---|
| Middle band | Usually a 20-period SMA. | The average price of the lookback window and a trend reference, not an automatic entry line. |
| Upper band | Middle band plus K standard deviations. | A relatively high price area. A tag can mean strength or extension depending on market regime. |
| Lower band | Middle band minus K standard deviations. | A relatively low price area. A tag can mean weakness or extension depending on market regime. |
| Band width | Distance between the upper and lower bands. | A visual measure of volatility contraction and expansion. |
What Are the Best Bollinger Bands Settings?
There is no single best Bollinger Bands setting for forex. The 20-period SMA with bands two standard deviations away is the standard starting point because it is the original default and is widely supported by charting platforms. John Bollinger explicitly describes these parameters as defaults rather than universal settings.
Some technical-analysis references also illustrate 10 periods with 1.5 standard deviations for shorter-term analysis and 50 periods with 2.5 standard deviations for longer-term analysis. These combinations should not be treated as prescriptions for day traders, swing traders or position traders. Changing the lookback and deviation multiplier changes the strategy and therefore requires separate testing.
| Illustrative setting | Behavior | Potential use | Risk |
|---|---|---|---|
| 10 / 1.5 | Faster and tighter. | Short-horizon volatility tracking. | More frequent touches and more noise. |
| 20 / 2 | Classic default. | General-purpose starting point. | Still needs market-regime filters and testing. |
| 50 / 2.5 | Slower and wider. | Longer-horizon context. | Late response and fewer signals. |
Are Upper and Lower Band Touches Buy or Sell Signals?
No. This is one of the most important rules in Bollinger Band analysis. John Bollinger states that tags of the bands are just tags, not standalone signals. A touch of the upper band is not automatically bearish, and a touch of the lower band is not automatically bullish.
The meaning depends on the regime. In a flat range, a lower-band extension followed by a close back inside the bands may support a mean-reversion setup. In a strong uptrend, repeated upper-band tags can indicate persistent momentum. The same visual event can therefore mean almost the opposite depending on context.
What Is a Bollinger Band Walk?
A band walk occurs when price repeatedly reaches or stays near one outer band during a strong directional move. In an uptrend, candles can ride the upper band while the middle average slopes upward. In a downtrend, price can walk the lower band. This is why shorting every upper-band touch or buying every lower-band touch is dangerous.
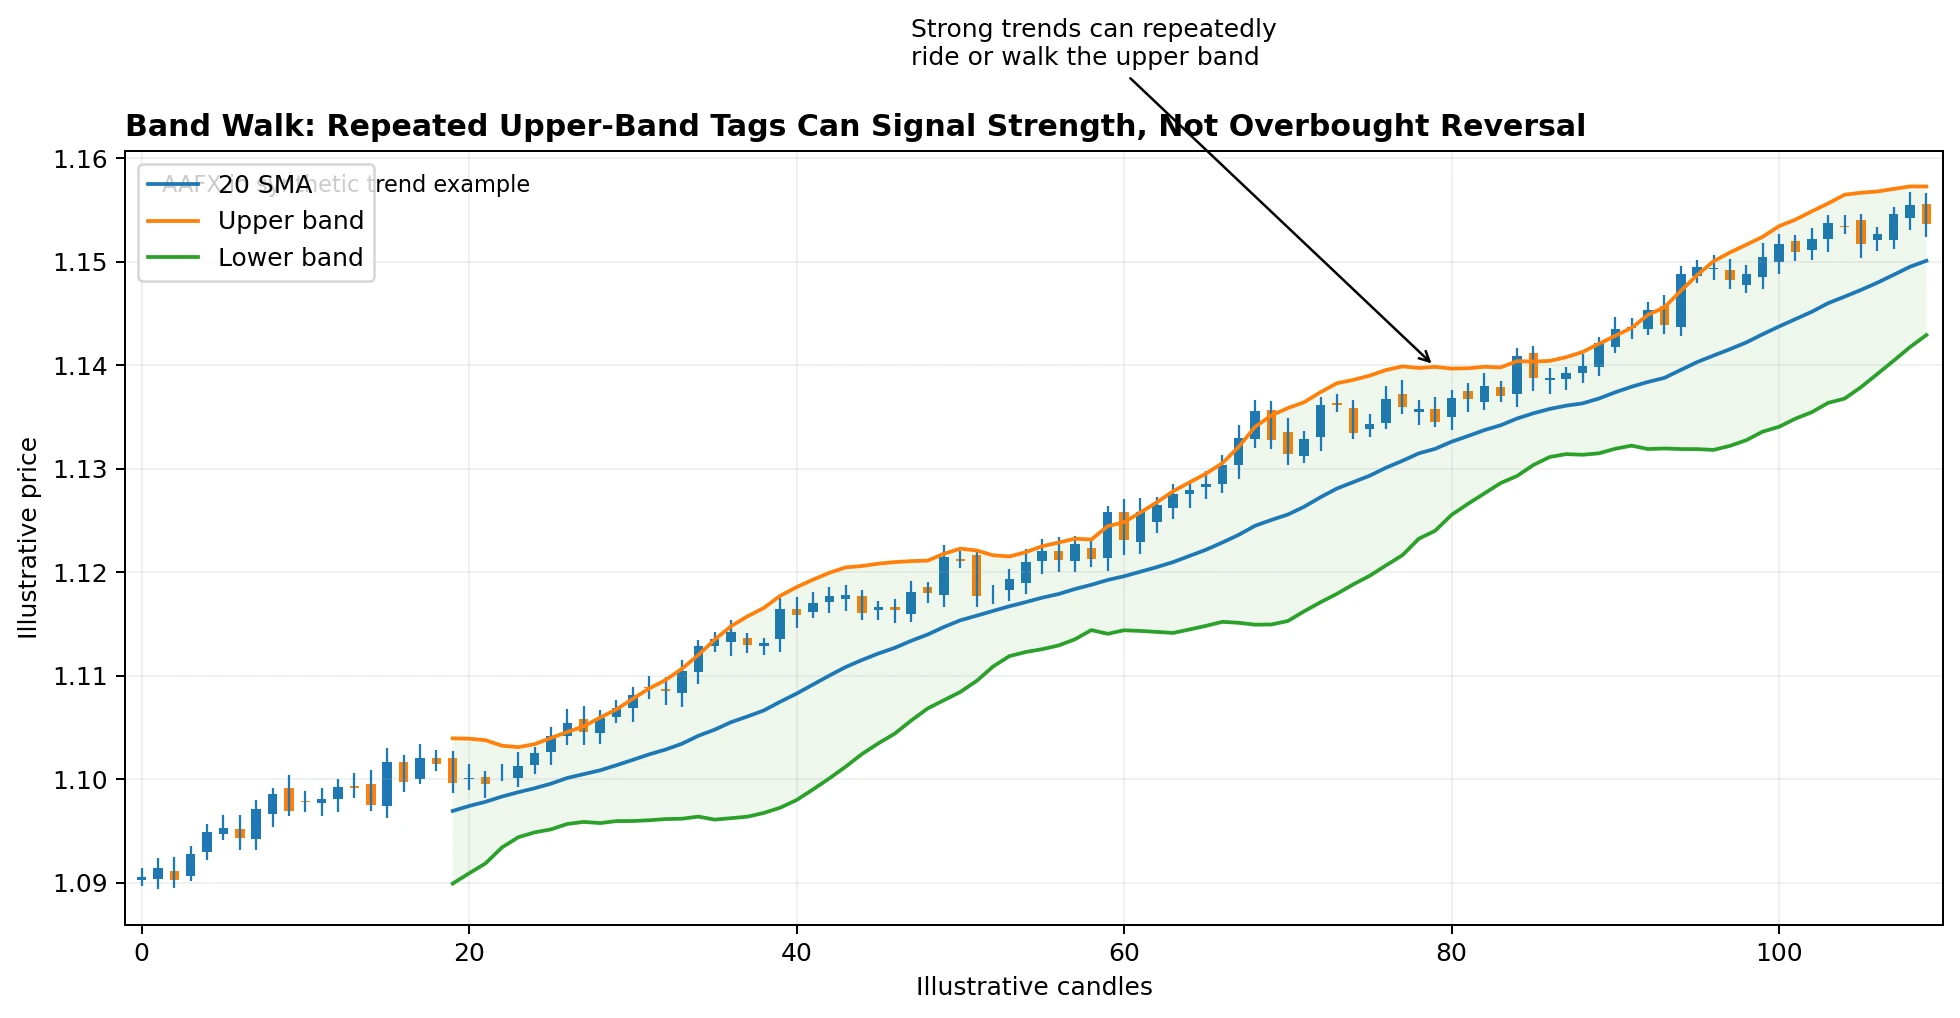
In a strong trend, price can walk an outer band for an extended period. Relative high does not mean price must immediately fall.
How to Read a Band Walk
- Check whether the middle band is clearly sloping in the same direction as the move.
- Look for repeated closes near the outer band rather than one isolated wick.
- Compare the trend with horizontal support/resistance and higher-timeframe structure.
- Do not label the market overbought or oversold only because an outer band is being tagged.
- Define what would break the trend, such as a structural reversal or sustained move back through the middle band.
Bollinger Band Squeeze Strategy
The Bollinger Squeeze describes a period when the bands become unusually narrow because recent volatility has contracted. Low volatility often alternates with higher volatility, so a squeeze can warn that a larger move is becoming more likely. It does not forecast direction.
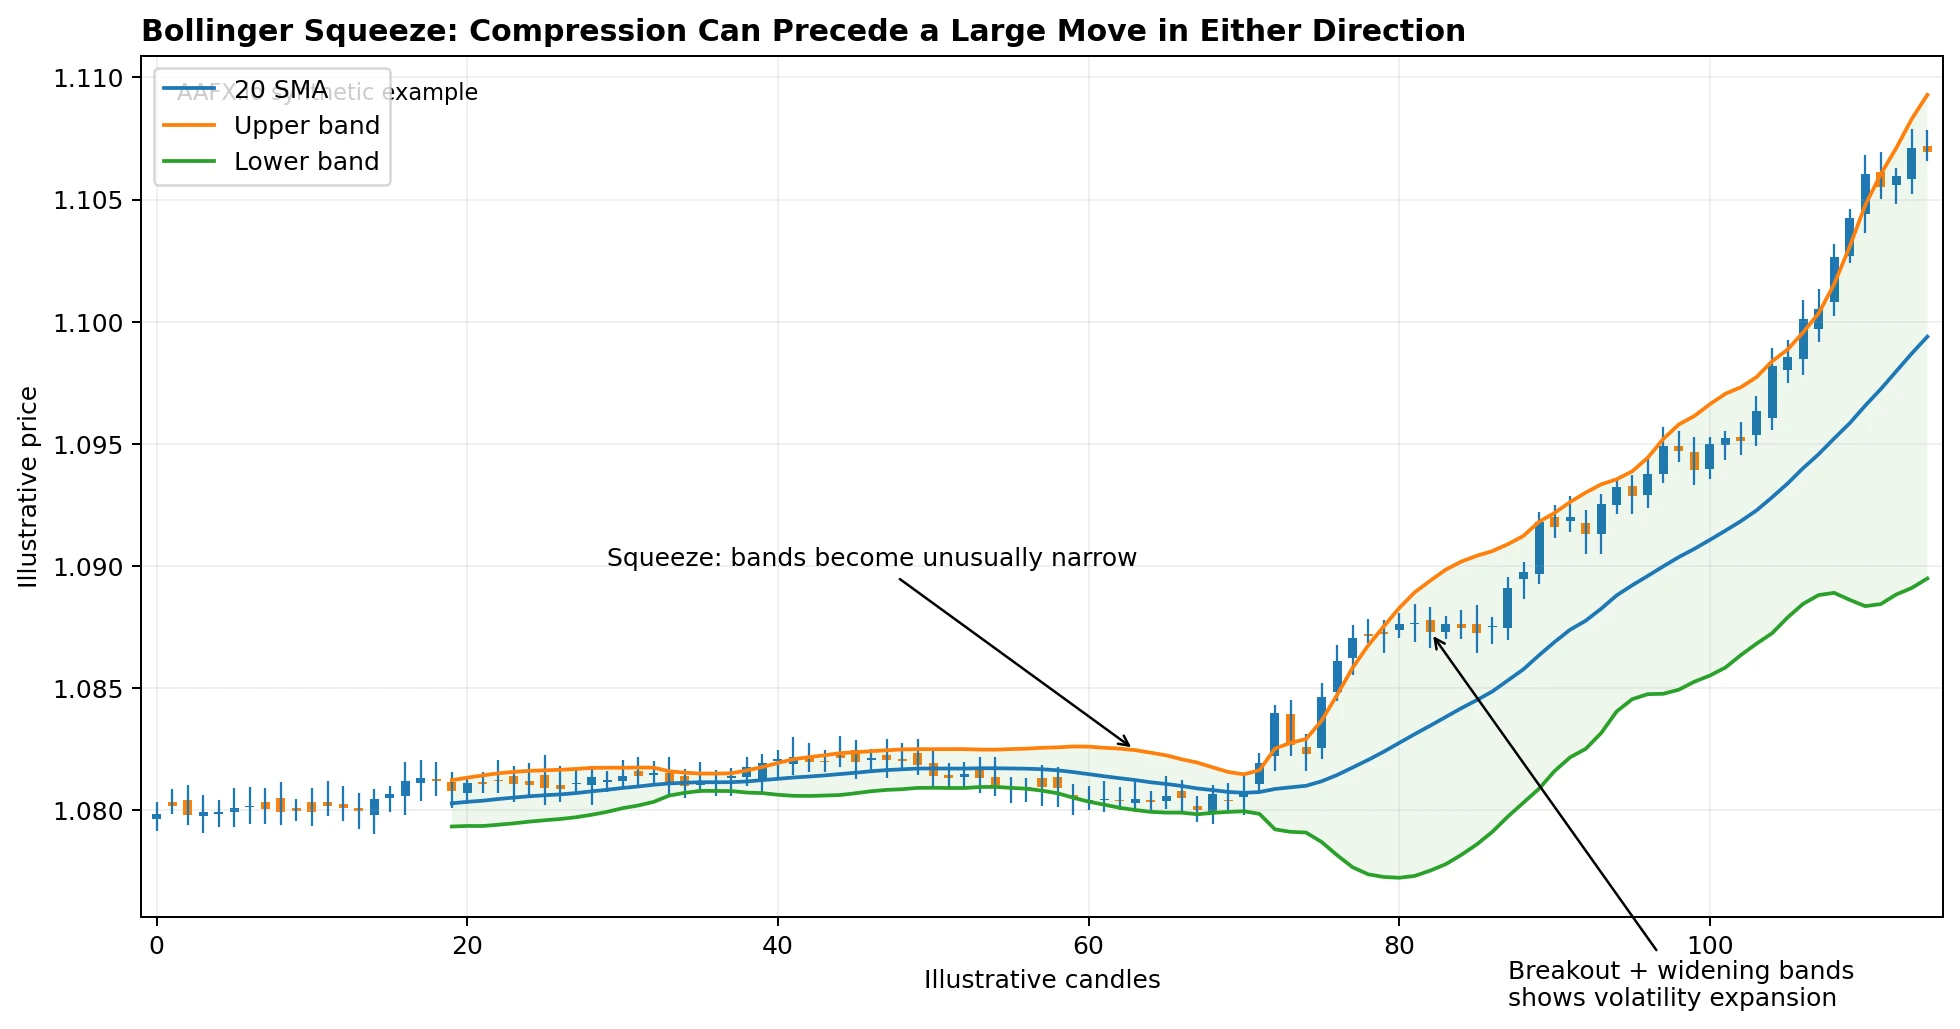
A squeeze identifies volatility compression. The later expansion tells us volatility has increased; the breakout direction still requires confirmation.
A practical squeeze strategy therefore needs two separate rules: one rule defines what counts as unusually narrow bands, and another defines the breakout. A candle closing outside the bands can be part of the breakout rule, but it should not be assumed that every close outside begins a sustainable trend.
What Is a Bollinger Head Fake?
A head fake is the false move that sometimes occurs after a squeeze. Price initially breaks in one direction, draws traders into the breakout, then reverses and expands in the opposite direction. Fidelity also warns that a false move can occur before the real trend begins.
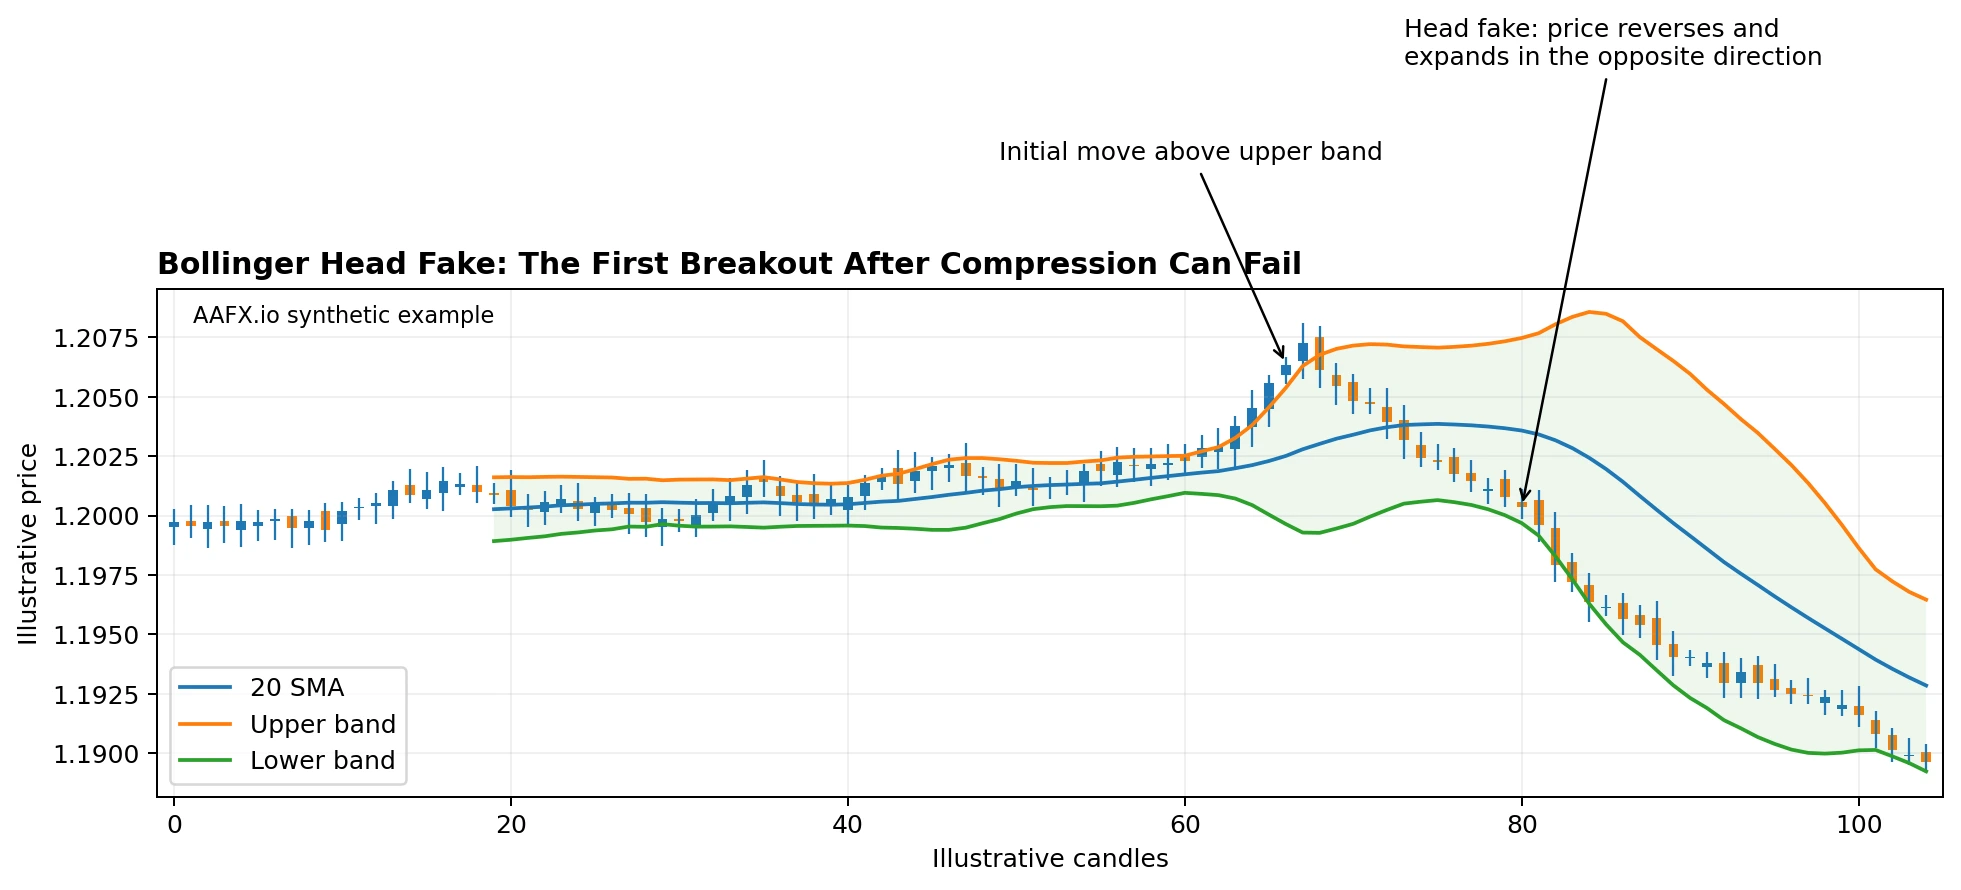
The first breakout after compression can fail. A head-fake rule helps separate volatility expansion from directional confirmation.
A head fake is not evidence of deliberate manipulation. The chart only shows that the first directional attempt failed. A robust breakout plan should specify whether it waits for follow-through, a retest, market structure, volume context or another confirmation condition.
Bollinger Bounce and Mean-Reversion Strategy
The Bollinger Bounce is a mean-reversion idea used primarily when price is ranging and the middle band is relatively flat. The concept is that an extension toward an outer band may revert toward the middle of the recent distribution. A common oversimplification turns this into a direct rule to buy the lower band and sell the upper band. That is too mechanical.
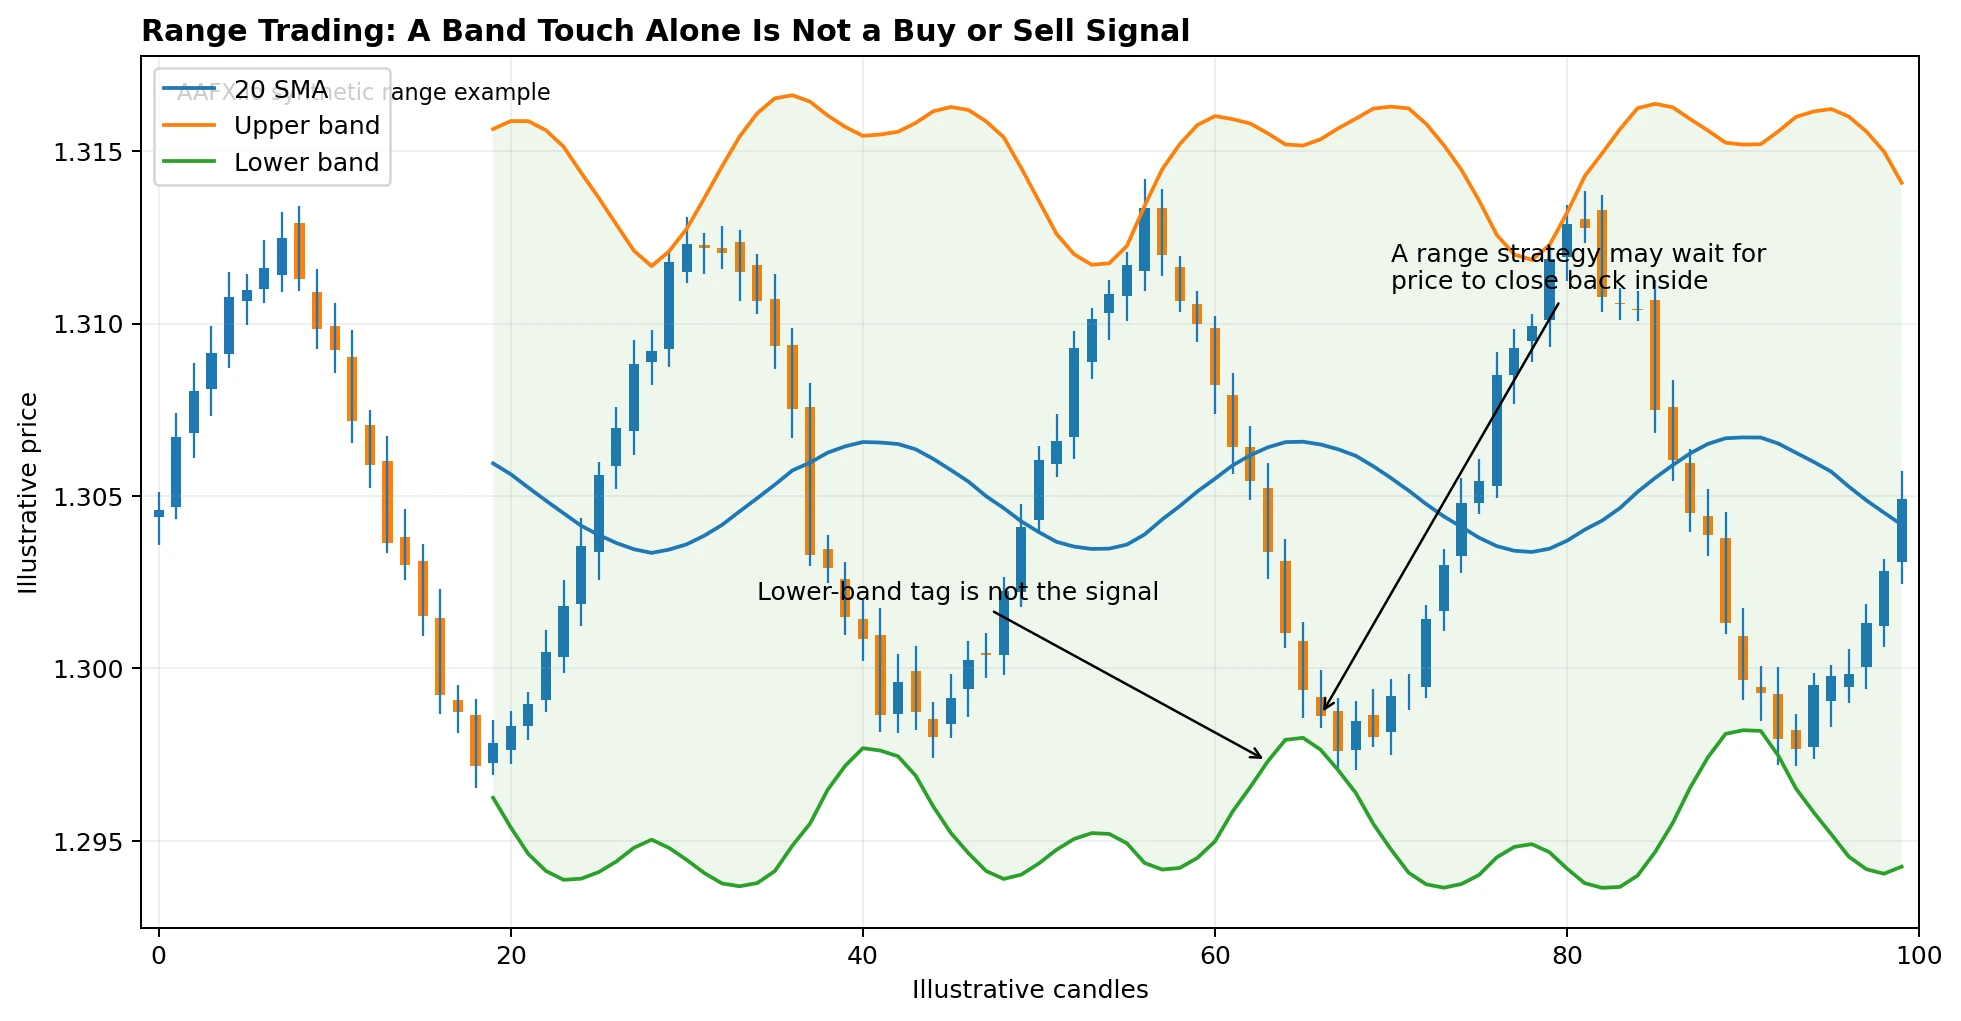
In a range, the outer bands can frame relative price extremes, but a band touch alone is not the entry. Price confirmation and nearby support or resistance should define the actual setup.
A More Defensible Range Framework
- Confirm that the market is genuinely range-bound rather than beginning a trend.
- Mark horizontal support and resistance before using the bands.
- Wait for price to test or briefly exceed an outer band.
- Require a defined reversal signal, such as a close back inside the bands or a completed rejection candle.
- Use the middle band or the opposite side of the range as a potential reference, not a guaranteed target.
- Place the stop where the range thesis is invalid and size the position using the AAFX.io risk-management framework.
W-Bottoms and M-Tops With Bollinger Bands
John Bollinger uses the bands to help clarify classic price patterns such as W-bottoms and M-tops. The key point is not simply seeing a double bottom or double top. The relative position of each swing compared with the bands can show a change in momentum.
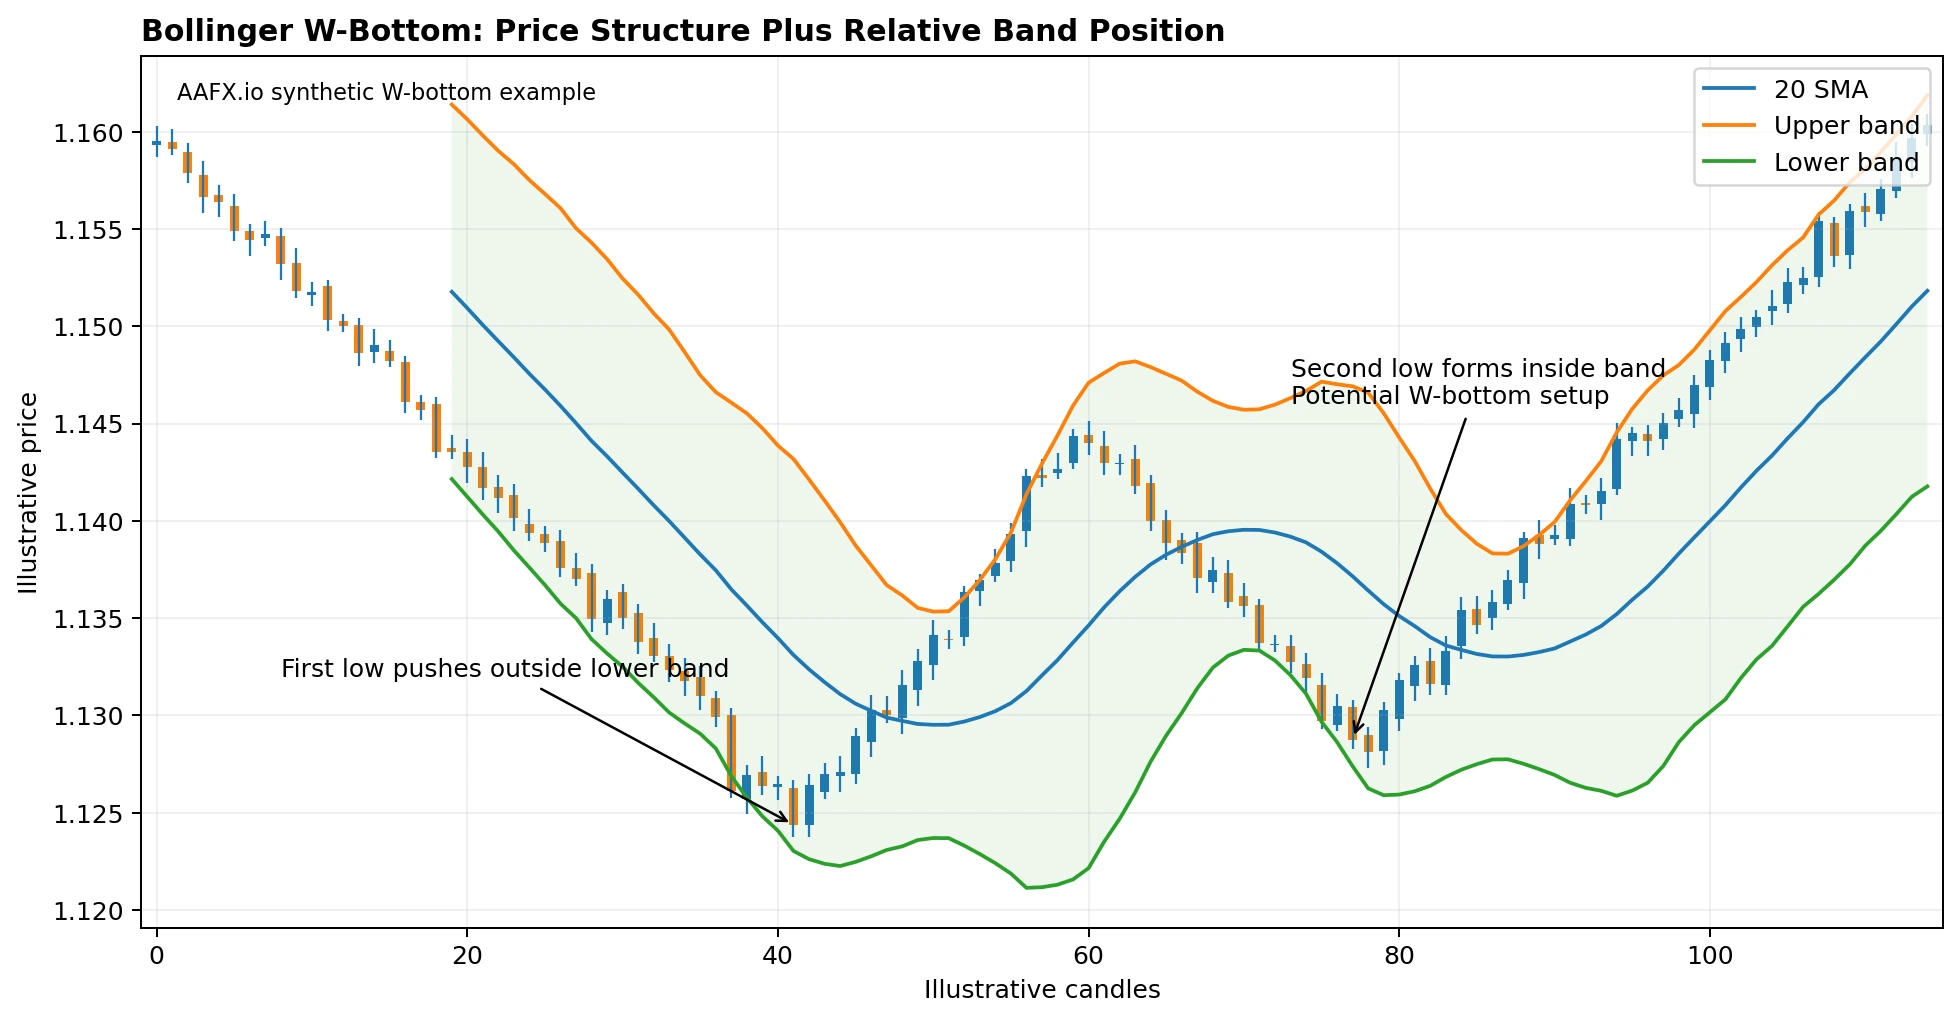
A classic Bollinger W-bottom often has a first low outside the lower band and a second low inside the band. The pattern still needs price confirmation before it becomes a trade.
Bollinger W-Bottom
A common W-bottom structure begins with a first low that reaches or pushes outside the lower band. Price rebounds, then later forms another price low or retest that remains inside the lower band. The second low does not have to be above the first in every pattern definition. The important observation is that the later test shows less downside extension relative to the band. Confirmation can come from a break above the reaction high or another predefined rule.
Bollinger M-Top
The M-top is the bearish counterpart. A first high reaches or exceeds the upper band, price pulls back, and a later high fails to show the same relative upper-band extension. That can indicate fading momentum. As with the W-bottom, the setup is incomplete until the strategy defines confirmation and invalidation.
Bollinger BandWidth and %B
Two companion indicators make Bollinger Band analysis easier to quantify. BandWidth measures how wide the bands are relative to the middle band. %B measures where price sits within or outside the bands.
BandWidth = (Upper Band – Lower Band) / Middle Band
%B = (Price – Lower Band) / (Upper Band – Lower Band)
A %B reading of 0 corresponds to the lower band, 0.5 to the middle of the band structure, and 1 to the upper band. Values can move below 0 or above 1 when price trades outside the bands. %B is a location measure, not an overbought/oversold command.
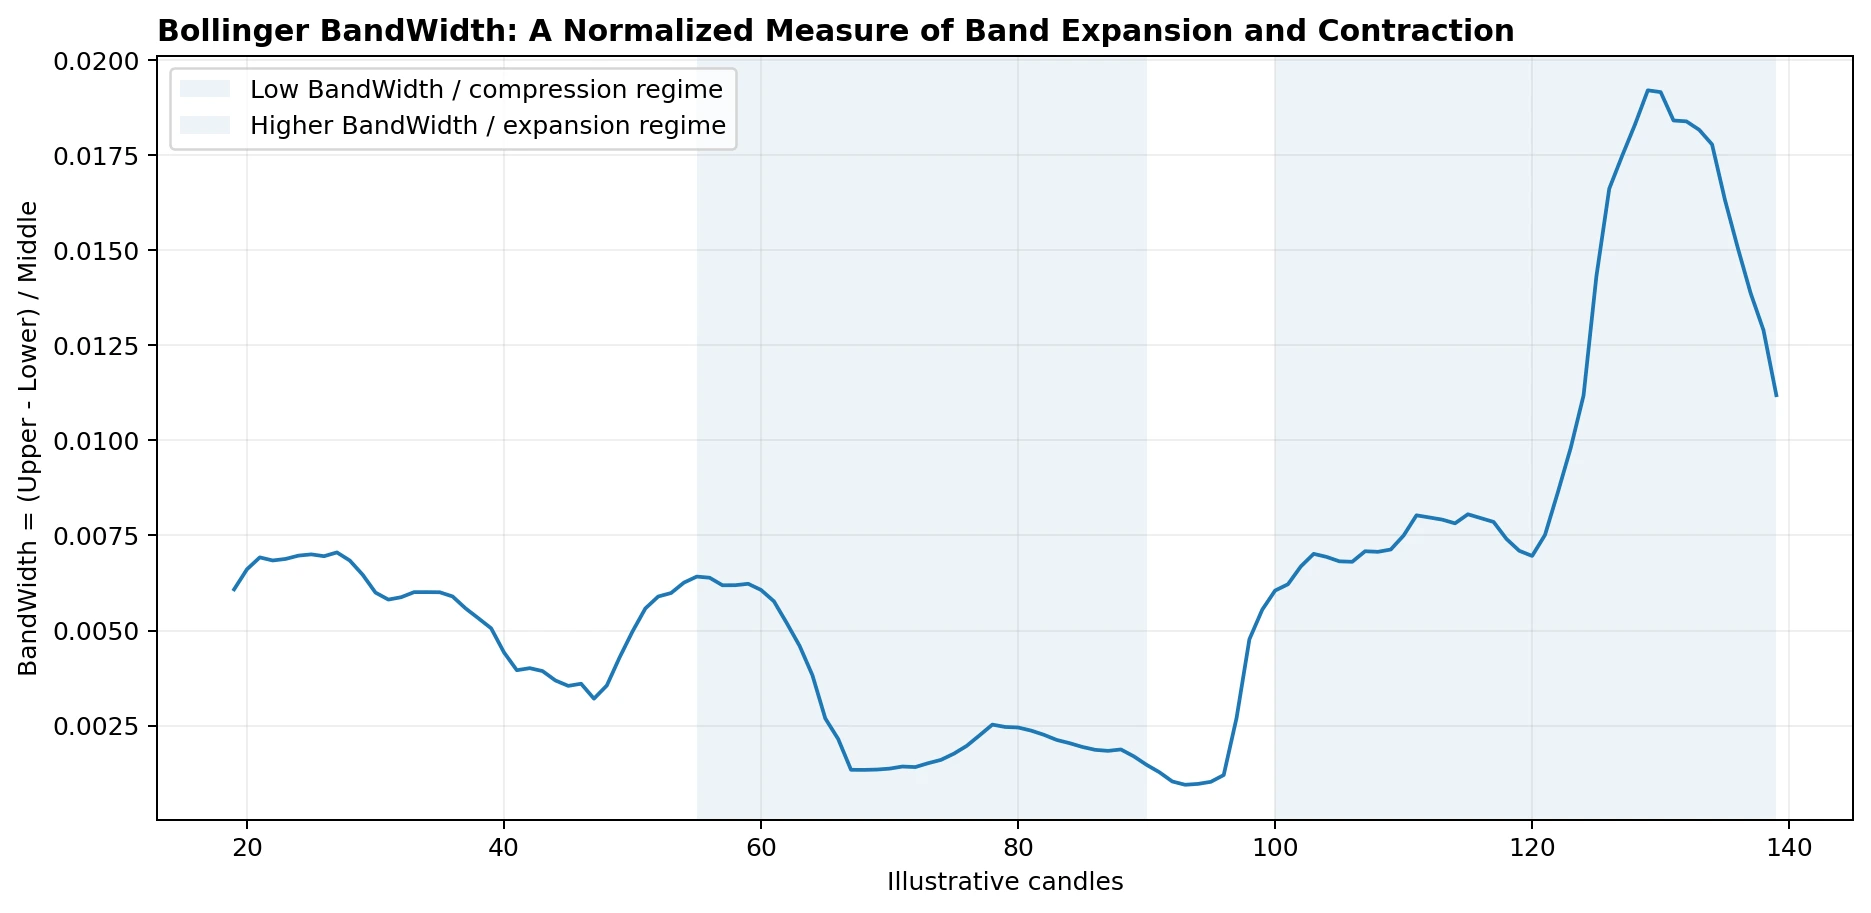
BandWidth converts visual band expansion and contraction into a normalized series, making it easier to compare squeeze conditions across time.
How to Use BandWidth
Rather than saying the bands “look narrow,” a strategy can define a squeeze using BandWidth relative to its own recent history. For example, a test might flag BandWidth when it falls into the lowest percentile of the prior 120 observations. That is only an example of a testable rule, not a recommended threshold.
Bollinger Bands vs Keltner Channels
Both tools place dynamic envelopes around a central average, but the volatility calculation differs. Bollinger Bands use standard deviation, which reacts to dispersion around the mean. Modern Keltner Channels commonly use Average True Range (ATR), which incorporates trading ranges and gaps. A Bollinger squeeze and a Keltner squeeze are therefore not the same signal.
| Feature | Bollinger Bands | Keltner Channels |
|---|---|---|
| Center line | Usually SMA. | Commonly EMA. |
| Volatility input | Standard deviation. | Average True Range. |
| Band behavior | Can expand rapidly when price dispersion jumps. | Responds to true range and ATR changes. |
| Typical use | Relative price location, squeeze, band walk, W/M patterns. | Trend envelopes, volatility breakouts and channel structure. |
How to Combine Bollinger Bands With Other Indicators
Additional indicators are useful only when they add a different type of information. Stacking several volatility or momentum tools can create the appearance of confirmation without adding a truly independent signal.
| Tool | Useful role | Common mistake |
|---|---|---|
| Support and resistance | Defines horizontal market structure around the band signal. | Treating the band itself as permanent support or resistance. |
| Candlestick patterns | Provides a completed rejection or continuation trigger. | Entering before the candle closes when the rule requires completed candles. |
| RSI | Adds momentum context and can help study divergence. | Assuming RSI 70/30 plus a band touch guarantees reversal. |
| ADX | Helps distinguish strong trend conditions from weaker directional markets. | Using ADX as a bullish/bearish direction signal by itself. |
| Moving averages | The middle band already contains an MA, so another average should have a distinct purpose. | Counting two similar averages as independent confirmation. |
Using Bollinger Bands Across Forex Timeframes
The formula is the same on every timeframe, but a 20-period Bollinger Band on a 5-minute chart describes only 100 minutes of data, while the same setting on a daily chart covers 20 trading days. The signal frequency, spread impact and noise level are therefore completely different.
A multi-timeframe approach can assign different jobs to each chart. A higher timeframe might identify whether price is walking an outer band or sitting in a broader squeeze. A lower timeframe can define the actual entry and invalidation. Do not mix timeframes after entry simply to avoid admitting that a setup failed.
Bollinger Bands Around Forex News
Major economic releases can create rapid volatility expansion, which causes the bands to widen only after the new price information enters the rolling calculation. That makes Bollinger Bands descriptive rather than protective. A narrow band before payrolls, CPI or a central-bank decision does not mean the breakout will be orderly, and a stop can still suffer slippage when liquidity changes quickly.
The indicator also does not measure total forex-market volume. Spot FX is decentralized, so any volume study used alongside Bollinger Bands is usually based on broker tick volume, provider-specific data or exchange-traded currency futures.
How to Backtest a Bollinger Bands Strategy
- Fix the Bollinger Band period, standard-deviation multiplier, middle-band type and applied price.
- Define the market regime: range, trend, squeeze or another condition.
- Write the entry rule precisely. A “band touch” must specify whether a wick, close or intrabar trade counts.
- Define confirmation, such as a close back inside the band, follow-through, breakout retest or market-structure change.
- Define the stop and position size before measuring returns.
- Include spread, commission, overnight financing and slippage assumptions.
- Test failed breakouts and band walks, not only clean textbook examples.
- Use out-of-sample data to check whether settings survive beyond the period used to design the strategy.
The biggest backtesting trap is switching interpretations after seeing the result. If a close outside the upper band counts as a breakout in one example, it cannot be treated as an overbought sell signal in the next example unless the strategy includes an objective regime rule that explains the difference.
Common Bollinger Bands Mistakes
Selling every upper-band tag
Upper-band tags can occur repeatedly in strong uptrends. A tag is not a standalone sell signal.
Buying every lower-band tag
Lower-band tags can occur repeatedly in strong downtrends. Relative low does not guarantee reversal.
Assuming a squeeze predicts direction
A squeeze signals volatility compression, not whether the next large move will be up or down.
Ignoring the head fake
The first breakout from a squeeze can reverse sharply. Confirmation rules matter.
Treating 20/2 as optimal for every market
The default is a starting point, not a universal parameter set.
Using fixed trader-type settings without testing
A 10/1.5 or 50/2.5 setting should be treated as an illustrative variation, not a prescribed day-trading or position-trading formula.
Confusing volatility with direction
Wide bands mean higher recent dispersion. They do not by themselves indicate bullish or bearish direction.
Calling outer bands support and resistance
They are statistical envelopes derived from price. Horizontal market structure is a different concept.
Overloading the chart with confirmation indicators
RSI, MACD, moving averages and Bands all derive from price. More indicators do not automatically create better evidence.
Ignoring risk
No Bollinger setup is complete without an invalidation level and a position size that fits the risk budget.
Bollinger Bands Checklist Before a Trade
- What market regime am I trading: trend, range or compression?
- What exact Bollinger settings and applied price am I using?
- Is the middle band rising, falling or flat?
- Are the bands contracting, expanding or already unusually wide?
- Is price tagging an outer band, closing outside it, or walking it?
- What independent price structure supports the setup?
- What event risk could change volatility abruptly?
- What is my exact confirmation rule?
- Where is the setup invalidated?
- What position size fits that stop?
- How will I handle a head fake or immediate move back inside the bands?
Frequently Asked Questions
What are Bollinger Bands in forex?
Bollinger Bands are volatility-adjusted envelopes around a moving average. They show whether price is relatively high or low compared with its recent distribution and how volatility is changing.
What are the standard Bollinger Bands settings?
The classic default is a 20-period Simple Moving Average with upper and lower bands two standard deviations away.
What is the best Bollinger Bands setting for forex?
There is no universal best setting. The 20/2 default is a common starting point, but any change in period or deviation multiplier should be tested on the exact pair, timeframe and strategy.
Is touching the upper Bollinger Band a sell signal?
No. John Bollinger explicitly describes a band tag as a tag, not a signal. Strong uptrends can walk the upper band.
Is touching the lower Bollinger Band a buy signal?
No. A strong downtrend can repeatedly trade near the lower band. A reversal strategy needs market context and confirmation.
What is a Bollinger Band squeeze?
A squeeze occurs when the bands become unusually narrow because recent volatility has contracted. It can precede a larger move, but it does not predict direction.
What is a Bollinger head fake?
A head fake is a false initial breakout after a squeeze that reverses and moves in the opposite direction.
What is a Bollinger Band walk?
A band walk occurs when price repeatedly reaches or remains near one outer band during a strong trend.
What is Bollinger BandWidth?
BandWidth measures the distance between the upper and lower bands relative to the middle band. It helps quantify compression and expansion.
What is Bollinger %B?
%B measures where price sits relative to the bands. Zero is the lower band, 0.5 is the midpoint, and 1 is the upper band. Readings can go below 0 or above 1.
How do W-bottoms work with Bollinger Bands?
A classic W-bottom often has a first low outside or at the lower band and a later low inside the band, suggesting reduced downside momentum. The pattern still needs confirmation.
How do M-tops work with Bollinger Bands?
An M-top often has a first high near or outside the upper band and a later high that fails to reach the same relative band extreme, suggesting fading upside momentum.
Are Bollinger Bands good for scalping?
They can be used on short timeframes, but shorter horizons contain more noise and spread effects. The settings and rules must be tested rather than assumed to work because the indicator is popular.
Can Bollinger Bands predict breakouts?
They can identify volatility compression before a potential expansion, but they cannot reliably predict the direction or guarantee that a breakout will continue.
Should I combine Bollinger Bands with RSI?
They can complement each other if Bollinger Bands measure relative price/volatility and RSI adds momentum context. Neither indicator should be treated as an automatic reversal signal.
Are Bollinger Bands a leading or lagging indicator?
They are based on historical prices, moving averages and rolling standard deviation, so they are backward-looking. Their usefulness comes from describing current relative price and volatility conditions.
Bottom Line
Bollinger Bands are most useful when they are treated as a volatility and relative-price framework rather than a collection of automatic buy and sell signals. The upper band means price is relatively high; the lower band means it is relatively low. What happens next depends on the regime.
In ranges, outer-band extensions can support mean-reversion setups when price confirms. In strong trends, price can walk an outer band. During squeezes, the key information is volatility compression, while the breakout direction remains uncertain and head fakes remain possible.
For AAFX.io, the strongest process is to combine the bands with market structure, candlestick confirmation and explicit risk management. The setup is invalid when price behavior no longer matches the regime or confirmation rule that justified the trade. The indicator should help define the scenario, not override what price is actually doing.
Editorial Sources
- John Bollinger: Official Bollinger Band Rules
- Fidelity: Bollinger Bands
- Fidelity: Bollinger Band Width
Risk warning: Forex and leveraged trading involve substantial risk. Bollinger Bands are based on historical price data and can produce false or late signals. Breakouts can reverse, band walks can persist, and stop orders may execute away from the requested price in fast markets. This material is educational and is not personalized financial advice.
Sources & Methodology
Primary-source standard: Market-moving facts should link to original data releases, regulator notices, company filings or official project announcements whenever available. Secondary reporting is used for additional context, not as a substitute for original evidence.
Page last reviewed: